"Let us see, from the standpoint of modern knowledge, whether light can be thrown on the difficult and vexed question of the real nature of wealth".......
Frederick Soddy;
Wealth, Virtual Wealth and Debt
Chapter Twelve
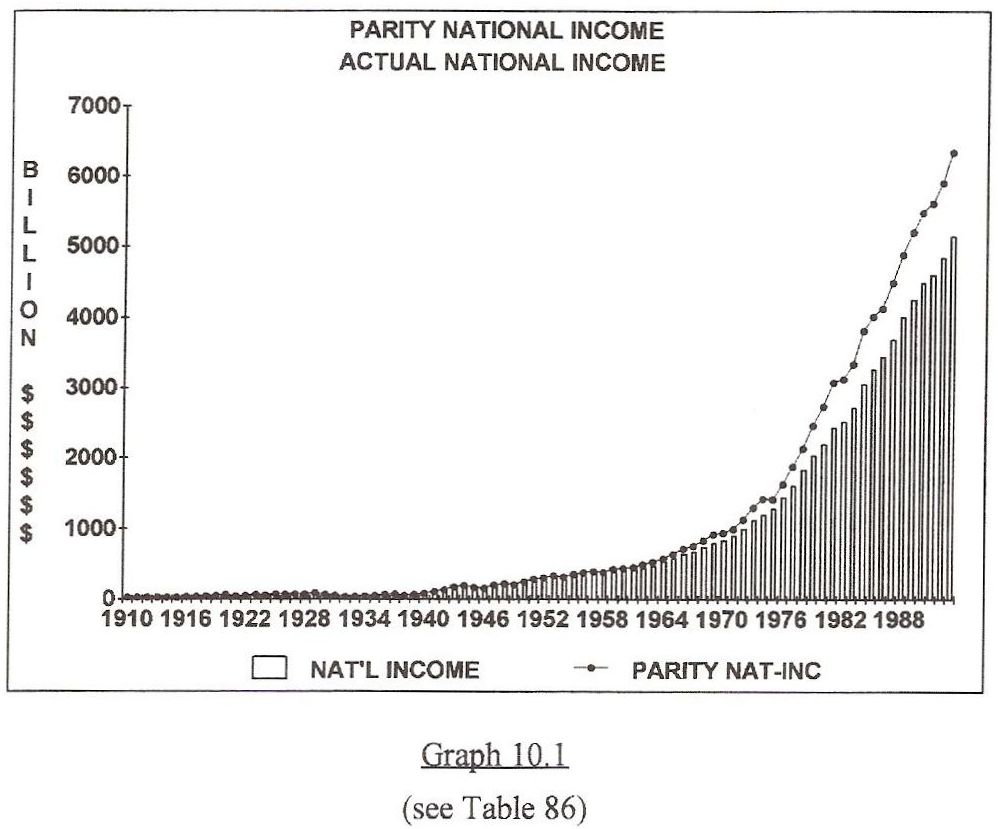
Parity National Income
 Public and private debt would never accumulate if National Income levels increased at a rate consistent with a prosperous base period standard. This standard for prosperity maintains the profits of private enterprise before taxes at about 1/3 of National Income. This level of profits is necessary to prevent debt expansion. This can be proven by accumulating the amount of National Income lost since the base period. Then, by subtracting actual National Income from an accurately indexed "Parity National Income" (the standard), one discovers that the difference exceeds the accumulated public and private debt over the same period. Thus, the economy would have operated at a profit if accurate price levels had been maintained. Had this lost income been earned into circulation at a Parity National Income level, earnings would be sufficient to pay the public and private debt plus provide Trillions of additional dollars of surplus money and additional wealth. See
Graph 10.1
Graph 10.1 describes these two levels of National Income. The lower line on the graph is the actual National Income since 1910. The upper line is the "Parity National Income" that uses the years 1947, 1948 & 1949 as a base period. The difference between these two lines is the total accumulated public and private debt expansion since the base period.
During the base period, the actual units of production times the actual prices paid for production generated a sufficient level of income to roll through the economy and purchase those same units of production as finished goods, without accumulating excess debt in the process. This roll over of earning power created optimal levels of National Income during the "standard" base period.
Parity National Income can be established by multiplying "production times price." For this exercise the following two indexes are utilized:
·1. the Industrial Production Index supplied by the Board of Governors of the Federal Reserve, and
·2. the broad based Consumer Price Index supplied by the U.S. Department of Labor.
By multiplying one index times the other index, times a factor "X" sufficient to produce the actual (Parity) National Income of the base period, a formula can be produced to identify the Parity National Income outside the base period. Therefore, the Industrial Production Index times the Consumer Price Index times "X" = base period National Income of $211.46 Billion Dollars. By actually performing this calculation we discover that "X" has a value of .39515.
The calculations are as follows:
Industrial Production Index (base period=22.87) times Consumer Price Index (base period=23.40) times the factor "X" (.39515) = actual (Parity) National Income of $211.46 Billion Dollars.
Parity National Income is calculated for all other years as follows: Industrial Production Index for the year times Consumer Price Index for the year times the factor .39515 equals Parity National Income for that year.
The base period of 1947-49 was a time when National Income was sufficient to facilitate consumption, growth and general prosperity while lowering per capita debt.
During this base period, relatively balanced percentages of National Income were earned by each segment of the economy so each segment could consume its pro rata share of the goods and services produced by other segments. The most accurately balanced period in U.S. history was 1946-50, and within that period always use 1947-49, because the U.S. Department of Commerce used it as a base period.
Today, the Consumer Price Index, which reflects the annual cost increases of consumer goods is growing faster than the amount of goods we produce domestically as expressed by the Industrial Production Index. This reflects a service and debt driven economy that imports excessive amounts of tangible goods and a society that adds unnecessary costs to its annual output. It reflects a system which can only be sustained through debt expansion. This is the inevitable result of economic planning that operates under the expectation that by increasing the value and volume of services, the economy can generate sufficient levels of National Income to offset increased amounts of imports, and the increased costs of borrowed money. This is impossible because services can't live off other services. The economy must produce, process, and distribute the new wealth provided by nature. Additional services can make life easier, but not necessarily better.
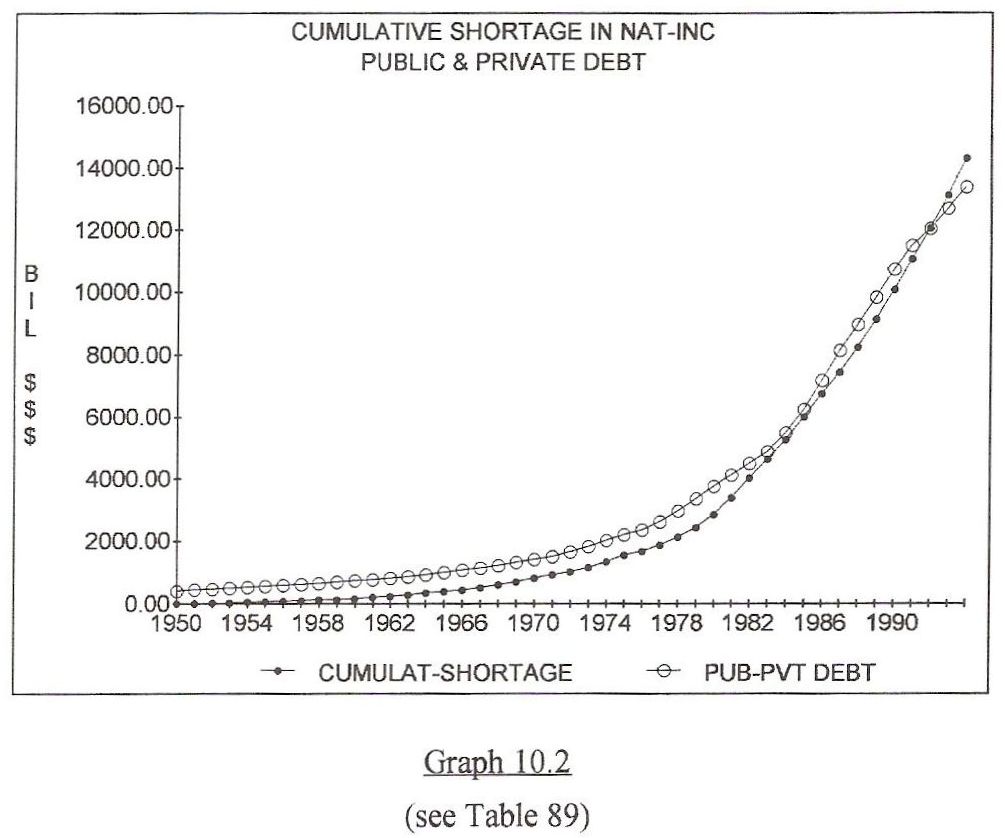
Graph 10.2
PAYING OFF THE PUBLIC AND PRIVATE DEBT
Graph 10.2 uses the Parity National Income formula to calculate the amount of National Income that was lost since the most recent base period of 1947-49. This exercise quantifies the amount of National Income lost since the economy left its "standard." Today, the lost income totals over Fourteen Trillion, Three Hundred Billion Dollars. This is the total lost profits of private enterprise since 1950. This total is 935.2 Billion Dollars more than the public and private debt accumulated since the base period. Therefore, America's accumulated National Income shortage is America's public and private debt. Obviously, if the economy earned the correct amount of income, the debt would never accumulate.
In 1993, the actual amount of funds in the capital pool totaled 925.5 Billion Dollars. This number demonstrates that an economy in balance will create sufficient income in advance of each production cycle to maintain adequate profit levels. Specifically, this capital pool should be the debt free currency that pays for the raw materials needed during the next production cycle which in 1993 had a par value of 870.5 Billion Dollars. Under this earned income system, a surplus of funds gradually accumulates since the original 1947-49 base period. Finally, in 1993, it totaled 55 Billion Dollars more than was necessary to maintain a par economy.
This quantifies a slow transition from a system of debt expansion to a system of earned incomes. In earlier chapters, we noted that a balanced economy will eventually "add up." This clearly demonstrates the math and the mechanics of such a system.
DEBT EXPANSION IS A POLICY OPTION
The previous calculations offer proof that debt expansion is a policy option. It shows that underpayments to raw materials since the 1947-49 period were replaced by debt and interest that can't be repaid. Therefore, the interest on the entire public & private debt becomes a growing production tax.
This can be further demonstrated by adding all shortages of raw materials income to the net interest paid on the debt that was used to replace the shortage of raw materials income.
This methodology yields logical answers. When the total shortage of raw materials income since 1929 is added to Net Interest for the same period, over 12.17 Trillion Dollars appear that should have been earned rather than borrowed into circulation. In fact, this analytical approach eliminates all but 1.2 Trillion Dollars of total public and private debt which is less than one year of production credit.
This formula demonstrates that any lost raw materials value must be offset by borrowing, and this borrowing produces the interest that remains in the economy as the reflection of lost value.
THE PARITY TRADE TURN
The Parity Trade Turn is the stationary sun around which all ratios revolve. The Parity Trade Turn is really the multiplier of Parity Raw Material dollars through the nations economy. To establish the Parity Trade Turn, two tables must be used that together comprise the inputs for the Trade Turn.
First, the Parity National Income Table was developed. It established the appropriate level of National Income for each year, using the 1947-49 base period as a standard. This table used the Industrial Production Index and the broad based Consumer Price Index to "ratchet up" the National Income at a level sufficient to maintain a workable standard for National Income each year.
Second, the Parity Raw Material Income Table 65 was developed. It required a study of prices and values of all raw materials dating back to 1910. The ratio of Parity Raw Materials Income to Parity National Income is the "Parity Trade Turn."
The concept of a trade turn, or a raw materials multiplier is expressed year by year on Table 87.
The Time Frame column confirms that all numbers are expressed as annual totals.
Column "A" lists a parity level of National Income which is the income level that should accrue from a full year of producing and distributing goods and services.
Column "B" is the product of the raw materials worksheet (Table 65). It is the annual total of raw materials income at parity levels that uses 1983-85 as a base period for oil, gas & fuel mineral production values (the energy group). It uses 1947-49 as a base period for the agriculture group by employing USDA's "prices paid index" methodology. This establishes parity prices for farm, fishery and forestry production. Then, by averaging the price levels of the energy group and the agriculture group, a parity price level for the industrial minerals and the recyclable group was established. When all three categories are totaled, they comprise Parity Raw Material Income.
Column "C" is the ratio of Raw Materials Income at Parity prices to Parity National Income. This is the ratio that could have existed today if fully valued raw materials had been used to regenerate the economy rather than debt expansion. This is the Parity Trade Turn.
Column "D" is the ratio just described but modified into a straight line or a mathematically normalized moving ratio which becomes the "moving mathematical constant ratio," or (the normal expanding trade turn over time). The trade turn must gradually expand at a specific rate to make room for more jobs demanded by more people. This expansion factor can be used to pre-calculate Parity National Income.
Column "E" is the variance between the actual parity ratio and the computerized straight line "normal" ratio. These variances net out to zero.
Thus, "The Parity Trade Turn" is established, which in January, 1994 was 1 to 7.28.
THE PARITY LABOR RATIO
Political structures and technological advances cause the labor income to be continuously re-divided, (either correctly through a proper price, or incorrectly through debt) and related economic pressures. Economists refer to the way labor is divided among all tasks as the "division of labor." In other words, labor resources are allocated by various factors including price, technology and demand, which place people in predictable jobs.
This "division of labor" changes as a society advances toward greater levels of sophistication. This causes more people to be replaced by machines, who then must retrain themselves to build or operate the machines that replaced them. Meanwhile, others design new machines that eliminate and create more jobs. This process, as traumatic as it seems, causes a society to advance. It's problematic to be sure, and functional measures should be taken to protect those most vulnerable.
If a society fails to retrain and assist those temporarily displaced in this growth process, these same improvements to efficiency will create structural unemployment. This problem is made worse by a low profit, debt saturated economy. This type of Laissez Faire advancement reduces the potential for economic growth. Such reductions are referred to by the American business community as "downsizing", and are acknowledged by the federal government as periods of "low growth."
Raw Materials Economics illustrates that the dependable economic generator throughout this process of advancement is raw materials income because as the populations increase, more raw materials (more energy) is used each year. The energy demanded by more people and the efficient application of that energy changes relative to technology. This energy is dependable. It will always be available to combine with labor and accumulated technology as long as the sun rises and sets over the four seasons of nature. Nature will credit people and people will debit nature as long as nature permits the intercourse! To optimize the efficiency of nature's credit, a natural balance must be maintained between the numbers of workers engaged in raw materials production and the amount of money paid to those workers.
The production cycle that flows from nature's credits, and thus the jobs that flow from a societal debit of nature, start with the retail production inputs needed to produce raw materials. It follows that employment and production will increase faster if relative values are maintained that fully distribute more production (nature's credit) to more people. In this way, a normally functioning production cycle can expand is size and efficiency consistent with population and technology. This continuously generates domestic growth as more people demand energy from the earth.
Numerous methods demonstrate that production cycles begin with the retail input items needed by raw materials producers and production cycles end with the final purchase and consumption of retail products or services. These economic cycles are complete when a house is built, the refined petroleum is used, food is eaten, or the essential service is bought at retail, and used.
The appropriate allocation of labor resources throughout this process has been quantified by compiling data from the Bureau of Labor Statistics which present annual totals of raw materials workers as a ratio to total industrial workers. This "labor ratio" is the ratio of raw materials workers to the total number of persons engaged in private industry (the non-government and non-military workforce). It moves in parallel with the money (or energy) that should be allocated to raw materials gross income during any year.
Therefore, the labor ratio and the parity trade turn must be the same if the economy is to remain in balance. That means, in 1994, for every person that should be engaged in raw materials production, the total industrial labor workforce should employ 7.28 people.
Consider this; a continuous flow of raw materials from the earth produces new income that represents energy. These new dollars proceed through the business community and the labor force as representations of raw materials. These raw materials eventually become goods and essential services for the entire population. The net sum of this credit is a society's ability to debit nature. This debit of nature is always represented in the economy by money (or energy) and jobs, or by some level of unemployment. This is how an organized society is credited by nature.
Therefore, the labor ratio (the ratio of raw materials producers to the total industrial work force) can be tracked over time in approximate parallel ratios to the accurate raw materials dollar flow (The Parity Trade Turn) or the debt subsidized raw materials dollar flow necessary to synthesize National Income.
The income from raw materials flows through all sectors of the economy and naturally produces the income that's used to distribute products and services to the total population. This causes the two ratios to function in parallel.
The ratio of Parity Raw Materials Income to Parity National Income has a parity labor ratio equivalent that is necessary to maintain full employment. This ratio is the Parity Trade Turn, which demands a dollar of gross raw materials income for every $7.28 of National Income. It also demands that 1 person be employed in raw materials production for every 7.28 persons engaged in private industry. Each time this natural ratio is violated, unemployment fills in the gap to restore the ratio.
Table 91-B, displays the labor ratio or labor turn. By reviewing the actual ratio of raw materials workers in Column B as a ratio to total persons engaged in private industry in Column A, we conclude that during our base period of 1947-49 the raw materials worker ratio to total workers was 1-to-4.39, which closely resembles the dollar ratio of Parity Raw Material Income to Parity National Income which averaged 1-to-4.12 during the same base period. The similarity of these ratios reflect a private enterprise system that's almost perfectly balanced. This solidifies a base period concept.
Table 91-B quantifies the current shortage of raw materials workers and proves there is insufficient money to pay them in the current economy. Over the past several decades, millions of raw materials workers have been permanently unemployed because the money to pay them never existed, or, it got trapped in the interest mill. Therefore, a shortage of raw materials income translates into a surplus of urban labor, and a shortage of raw materials workers translates into a surplus of urban labor. This surplus of urban labor is now called America's "natural rate of unemployment" which grows each decade.
Again, the raw materials labor force, should be paralleled by the dollar flow of Parity Raw Material Income. This parallel flow of energy and money leaves the raw materials producer and passes through each stage of the production cycle to pay labor and business. The rollover of raw materials income is referred to as a Trade Turn, and the parallel stages of labor produce the labor ratio. When this energy flow and money flow is totaled for the year, after passing completely through the production cycle, it equals annual National Income.
At the completion of each production cycle, the residual energy of raw materials in the form of finished products becomes the total profit and savings the society earned for the effort.
Therefore, National Income represents the total amount of energy exchanged and accumulated through the production and distribution of raw materials.
In 1993, the labor ratio and trade turn should have been 7.28 to 1. In 1993, each $1.00 of raw materials income paid at the first point of sale, produced $7.28 of National Income. But since raw materials prices were so low, this rollover or multiplier of income only produced 1/2 of the actual National Income. The remaining National Income was the product of debt expansion. Likewise, each person engaged in raw materials production actually created employment for 7.28 persons employed within the industrial workforce. But, since too little money was available, over 8 million people remained unemployed and millions more under-employed. In a balanced economy 12 million people would be engaged in raw materials production out of a total industrial labor force of approximately 96 million people. Instead, only 4 million people are engaged in raw materials production, and this leaves 8 million unemployed.
Today, the necessary ratios have been altered by debt expansion and unemployment. This has produced actual ratios that reflect a complete disruption to the natural balance of private enterprise and express the reason for America's structural unemployment.
SUMMARIZING THE RATIOS
The raw materials income at the first point of sale, or its debt substitution, earned by (or borrowed within) new wealth industries is the economic "starter motor" that is first to employ the skilled labor force. This sets price levels in other sectors of the economy and ultimately defines the total volume and quality of employment for the nation.
Increasing raw materials volumes and income, while adding to the M-1 money supply sufficient to reflect accurate volumes and values for raw materials at the first point of sale is like push starting the economic cycle. This action provides barter power to pull on the consuming end of the economic cycle. This balanced push/pull system allows production and consumption to occur without creating capital debt.
The economy will function without producing unrepayable debt if sufficient earned consumer income is created within the production cycle. This income is produced automatically when consumers contribute their labor to the production of goods and services at individual stages of the same production cycle. In this system, parity raw materials prices insure parity employment and parity wages. Conversely, sub-parity raw materials prices insure increased unemployment and a decrease in wage rates.
In a balanced economy, the number of people employed by industry and the dollars that pay these people operate in reciprocal harmony, and by maintaining this harmony, the trade turn and labor ratios move forward together.
MAINTAINING LOWER RATIOS THROUGH DEBT EXPANSION
Inevitability, when "net debt expansion" is added to raw materials income and calculated as a ratio to National Income, the ratio of about 1-to-5 always reappears. (Net Debt Expansion is the sum of annual debt expansion minus Net Interest) This demonstrates the predictability of the economy and the importance of properly valuing the energy within raw materials. Likewise, when the actual number of persons employed in raw materials production is added to the total persons unemployed and under-employed, and calculated as a ratio to the total industrial work force, the same ratio of 1-to-5 reappears. The ratio of about 1-to-5 always reappears after the economy self adjusts for debt expansion, and for inappropriate changes to the division of labor, because a living and dynamic economy makes natural attempts to restore itself to a previous level of structural balance. Therefore, since the economy has been prevented from moving to the higher earned income ratios of 1-to-7.28 which is the correct ratio for today, it continuously attempts to return to the base period ratio of about 1-to-5. This is another reason that all the ratios on Table 74 in Chapter 9 are approximately 1-to-5.
This destructive system has retarded growth and pushed the American economy into low incomes and high debts. Consequently, a false efficiency has been produced that manifests as structural unemployment. Restoration of proper ratios is necessary if national economic balance is to be restored.
The difference between a par economy that operates at proper ratios and the debt supplemented economy of today, is pent up growth, increased debt, under-employment, unemployment, under-consumption and increased unearned income that erodes profit. Today, this "new" economy refuses to earn its necessary level of National Income because it blindly demands underpriced labor and production throughout the production cycle.
THE RATIOS ARE EXPANDED BY ENERGY
The labor ratio and trade turn are predictable energy based moving mathematical constant ratios that indicate the level of technology of the period (the sophistication of manufacturing), the efficiency and productivity of labor and the volume of raw materials in flow.
The computerized straight line parity ratio is 1-to-6.5. This compares to the actual parity ratio (defined by the current state of the arts) at 1-to-7.28. This means in a par economy, efficiency would be improving. Instead of this natural ratio, the economy is operating at about 1-to-5, almost exactly the same ratio as the 1947-49 base period. So, due to the inefficiency of debt expansion, the economy is operating at far less than its potential energy efficiency and is creating unnecessary unemployment as a by-product.
Table 91-B clearly demonstrates the expanding labor ratio and the expanding trade turn. More energy within the system causes more dollars to flow through the system; causing the system to expand. This creates a pattern of expected increased efficiency during future years. This long term pattern has produced a normal ratio of 1-to-6.5 in 1994. Thus, the ratio of raw materials income at parity, to Parity National Income, and the parallel labor ratio gradually increase at a historical normal rate.
This examination proves the existence of a predictable mechanism that can be used to monitor growth and employment. The ratio of parity raw materials income, to Parity National Income, is the naturally balanced trade turn that establishes total earned National Income and total industrial employment. Therefore, it provides the framework for prosperity. This ratio establishes the most efficient use of the earth's energy.
As our society grows and becomes more sophisticated, manufacturers should produce new and better items from raw materials with less physical work and diligence, but, with the same relative level of profit per unit of production after adjusting for net productivity increases. This maintains a par level of income for manufacturing.
This is real efficiency advancement, and when combined with the increased population should allow the persons engaged in private industry to double since the 1947-49 base period while maintaining (almost the exact) number of persons in raw materials production.
If the expansion rate of the labor ratio and trade turn exceed technology for any year, structural unemployment will inevitably result, as is the situation today.
Many economists misinterpret technological advances to mean that per unit prices of raw materials and finished goods must continuously decrease if their volumes are increased. However, applying such logic to public policy without regard to state of the art productivity pushes millions of people into poverty and unemployment.
Many economists confuse increased volume with increased productivity. Records show that pushing people out of production and manufacturing jobs in advance of the formula's dictated by these moving parallel parity ratios, only shifts National Income from the left side of the T-chart to the right side of the T-chart. This adds more cost to the economy. Consequently, low wage jobs resurface as non-essential service sector employment or government "make work" programs. This further confirms that raw materials values must remain at par with the costs of finished products made from raw materials as products flow through the production cycle. Otherwise, the entire system must be supplemented with debt in order to expand. Or, as a third alternative, it must be downsized to reflect the lost income.
The American economy is operating under a false "value added" theory where the value of all products and services is calculated in terms of "cost." This scenario establishes a circle of cost rather than a circle that yields the residual profits of private enterprise. This theory suggests that wealth has no beginning and no point of consumption. Thus by logical extension, all energy becomes a cost factor that can't be quantified as valuable matter. Such a belief system violates the laws of physics and condemns the American system to death by debt.
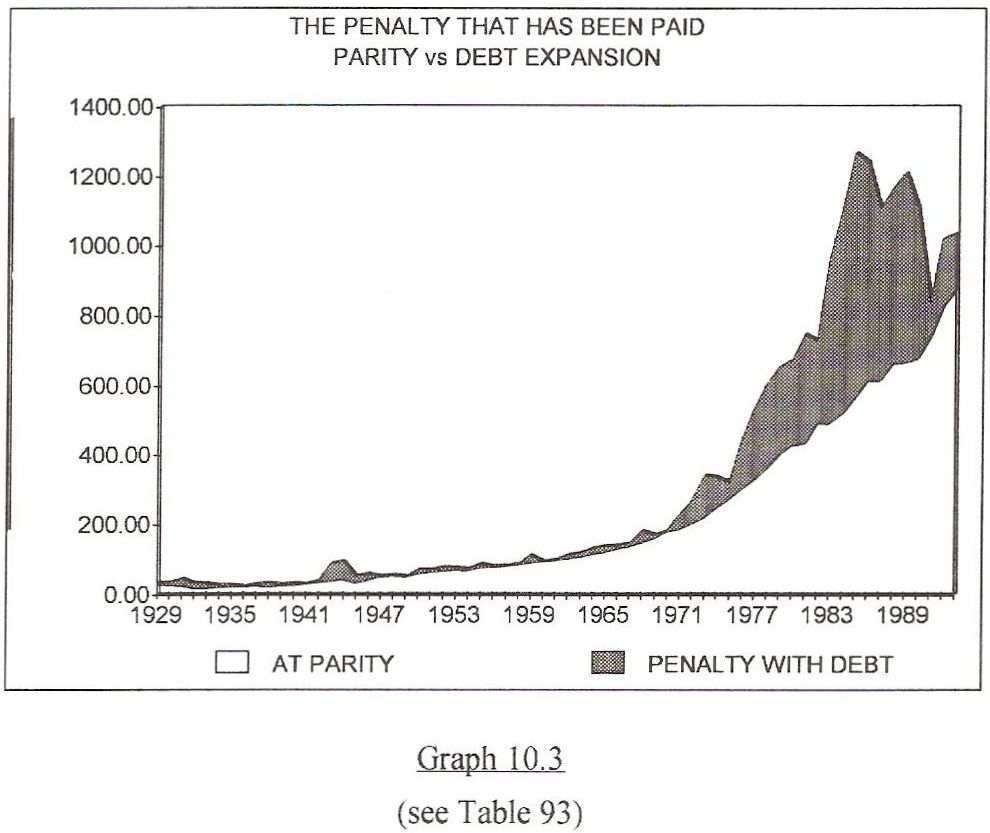
LOWER TRADE TURN
Today, the American private enterprise system is maintained by an annual debt subsidy. The compound interest that accumulates from this subsidy affects efficiency the same way an automobile is affected by driving 55 miles per hour in low gear. The engine runs fast and makes a lot of noise, but the car uses too much fuel and takes too long to arrive at its destination. It also causes parts to wear out prematurely. Graph 10.3 reflects this situation in dollar form. The top line on the Graph is the total amount paid for all raw materials during each calendar year plus the public and private debt expansion necessary to supplement the flow of goods and services through the various channels of commerce.
The Graph illustrates that when debt expansion is added to underpriced raw materials income and the combined total is expressed as a ratio to actual National Income, the ratio is invariably lower than the ratio of raw materials income at parity to Parity National Income.
Graph 10.3
As you can see, debt expansion plus raw materials income requires more total dollars than parity raw materials income to accomplish the same task. Therefore, debt expansion demands a lower gear from the economy so products and services can be pulled toward consumption. For this reason, the current debt supplemented trade turn (the ratio of actual raw materials income plus debt expansion to National Income) is about 1-to-5 which is much lower than the parity trade turn of 1-to-7.28. The difference in efficiency in terms of ratios is the subject of Graph 10.3. The space between the two lines is a net loss to efficiency caused by the debt burden imposed on the economy.
This makes the reasons for depressions and recessions obvious. The United States has never had a depression or even a recession due to the lack of energy based natural resources or the labor to process resources into finished goods.
America's economic problems can be traced to the manipulation of values through the inappropriate use of money and credit. This slows down production and reduces consumption. Today, this manipulation of money and credit reduces profits and produces permanent poverty.
Over the long term, a low profit economy forces more production and manufacturing facilities to become "sub-marginal" meaning some businesses must be closed every day. Their liquidation is caused, not by their own incompetence or lack of efficiency, but by the very economic system that fostered their development.
Today, there is too much debt at every level of the American economy. This has forced the trade turn and the labor ratio to be distorted. This forces unemployment on the entire nation and it causes productive businesses fail each year.
Graph 10.3 demonstrates how the extra expense and lost efficiency associated with debt can be charted in terms of ratios and dollars. Society has paid too much for operating the economy. This penalty is the dollar difference between the two lines on Graph 10.3. The Graph illustrates that, earned income is more efficient than debt expansion.
For several decades, the private enterprise system has blindly absorbed debt into the economy to maintain the flow of goods and services. But as Graph 10.3 shows, our nation's inability to monetize wealth has produced over payments to the right side of the T-chart. This overpayment is a product of excessive wage and interest costs relative to overall profitability. Remember, additional interest cost subtract from, rather than add to the efficient flow of "metabolic or kinetic energy." This Graph reflects lost efficiency due to excessive interest and excessive debt.
In a properly functioning private enterprise system, the normal exchange of goods and services produced within the economic cycle will optimize employment, distribution and consumption without excessive debt expansion! For this to occur, the monetization of raw materials must be established and maintained by a policy that will index the price of raw materials at the first point of sale to the price of retail goods and services.
In other words, a prices paid index which tracks retail prices paid for inputs and living expenses by raw materials producers must be kept in balance with the prices that raw materials producers receive for their production.
Raw Materials Economics demands that raw materials prices be indexed so the most accurate ratios, relative to maximum growth and employment, can be maintained.
Simple arithmetic proves that neither "Say's Law of Markets," (which states the act of producing automatically creates the economic credits that provide for consumption), or the "law of supply and demand," (which is a misnomer) can serve the greater good because destructive competition and predatory business practices act to offend their own self interests. This inhibits the distribution of products and service. Therefore, a society must establish policies that maintain a natural balance between domestic price levels. This balance should be maintained through an "energy value index."
This index must track the metabolic and kinetic energy value of raw materials, labor, and the tangible value of finished items because all costs must eventually be paid (or owed to a lender) in order to consume retail products. This index can become a singular output formula that prevents periodic inflation, deflation, and economic convulsions. This index system will maintain optimum incentives for high growth rates at full employment.
An indexing system that identifies necessary levels of earned income for all five segments of the economy will demonstrate mathematically that an increase in the Consumer Price Index (CPI) must always be inflationary and an increase in the Industrial Production Index can never be inflationary. Raw Materials Economics provides all the incentives for the latter and no incentives for the former to all engaged in American commerce.
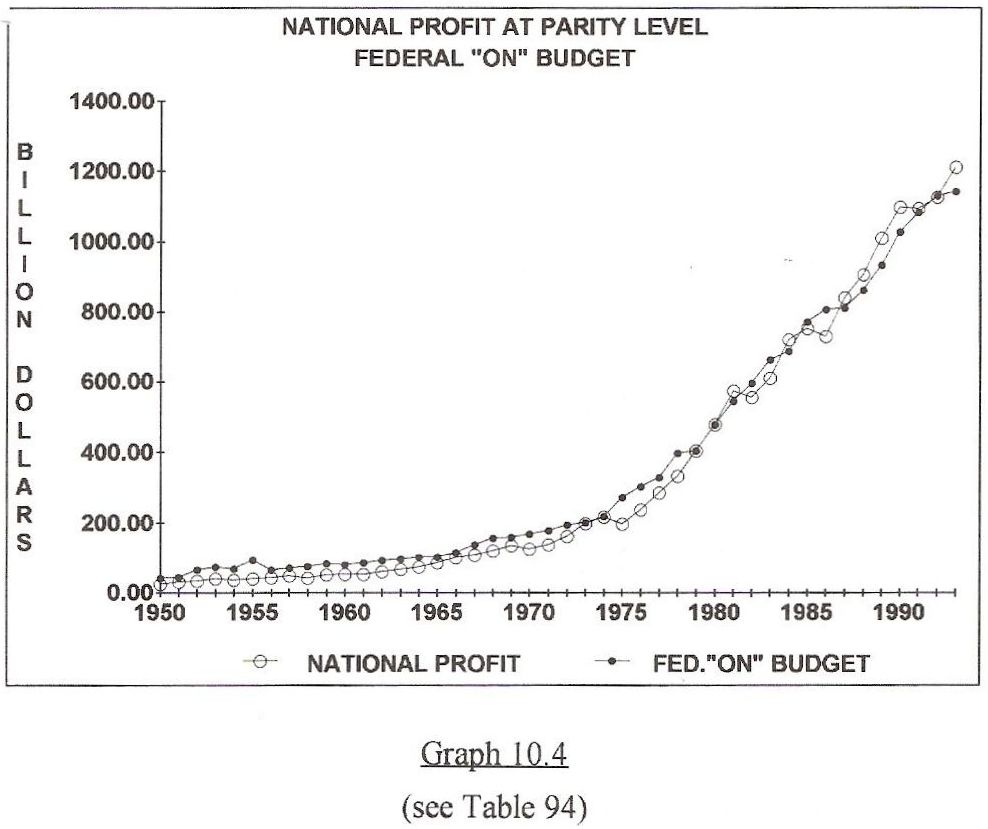
Graph 10.4
Graph 10.4, and Table 94 display the concept of a "National Profit Floor" created by raw materials income at parity. The Table also explores the concept of a national cash profit that becomes available under a par economy. Column A displays the Parity Profits of Private Enterprise or an amount equal to 1/3 of Parity National Income. Column B displays raw materials income at parity. This value should not be taxed away because it's necessary to mobilize and finance the next cycle of production. Column C is the difference between Columns A & B. It represents a cash profit that should always pay for the "on" budget outlays expressed under Column E.
Graph 10.4 compares Columns C & E under a hypothetical par economy. As you can see by comparing the two lines on the Graph, the profits of private enterprise would have paid for "on" budget outlays almost every year if the rules of Raw Materials Economics had been followed.
Table 95 shows the actual amount of taxes collected by the IRS and compares this total to the annual parity value of raw materials at the first point of sale for each year since 1947.
Since the end of WWII, the Internal Revenue Service has maintained a level of taxation approximately equal to the value of raw materials income at parity. In terms of Raw Materials Economics, almost all new wealth (or energy) was removed from the private sectors and temporarily "parked" in government coffers.
Raw materials income at parity is an invisible but very real foundation under the profits of private enterprise. This foundation can't be penetrated without further deteriorating consumption patterns all across the private enterprise system.
Table 96 answers the long standing question. Can the federal budget be balanced?
Column A is a record of parity profits. It represents the money private enterprise should have earned, but was not allowed to earn.
Column B is a record of Parity Raw Material Income. This gross income should have been earned by the private enterprise system.
Column C is the maximum dollars that a properly functioning private enterprise system can be taxed without deteriorating production, employment, and consumption.
Column D reflects the maximum tax rate that can be charged to a private enterprise system that operates in balance.
Column E is the actual annual budget outlay.
Column F is the value of labor's take home pay under a par economy.
Column G is the take home pay of labor (Col. F) plus the parity profits of private enterprise (Col. A).
Column H is the overall tax rate necessary to balance the budget.
Under a par economy, private enterprise and labor will maintain the resources to pay for government services every year. As Profits of private enterprise are restored and wages achieve parity, the government expenditures for social welfare, entitlement programs (such as Food Stamps, Unemployment Compensation, AFDC, Medicaid and Farm Subsidies) and interest on the debt will automatically be dramatically reduced; lessening the burden of government on taxpayers.
MAINTAINING AND FORECASTING A PAR ECONOMY
The long term normal advancement of a par economy guarantees a balanced budget through (the expanding trade turn). This system can be forecast with certainty after an accurate indexing system is in place.
As already shown, the parity trade turn is established by dividing Parity National Income by parity raw materials income. Parity National Income is indexed from the 1947-49 base period.
A par level of economic activity always flows from a balanced economic structure and this flow can always be projected into the future using the average annual straight line increases in the ratio of parity raw materials income to Parity National Income.
This is the formula used by NORM to project optimum growth. The formula projects average annual increases in the Parity Trade Turn of .04956. This annual increase is the optimal level of growth that can be sustained by a par economy. A par economy can always prosper without increasing debt in ratio to earnings if this standard is maintained. Maintaining a Parity National Income is a cornerstone of Raw Materials Economics because it's necessary to prevent needless debt expansion.
A smaller annual expansion factor of .02053 (which results in a lower ratio) actually exists in our economy today. This is due to federal policies which cause the economy to be driven by debt expansion and the "profits" on interest.
A 1-to-4.17 straight line (normal) debt supplemented ratio of raw materials income plus debt expansion to National Income exists today. It reflects a deteriorating "return for the borrowed buck." In essence, the non-sustainable debt subsidized trade turn does not properly mobilize the economy. There is a big difference in overall operating efficiency depending on which system is chosen because when Parity Raw Materials Income is calculated as a ratio to Parity National Income on a straight line moving average, the ratio increases to normal level of 1-to-6.5 or an annual expander of approximately 0.04956.
The actual ratio of 1 to 4.17 contains less than one-half (41.4%) of the potential efficiency necessary to produce enough new jobs each year to maintain full employment. The economy could afford these jobs if the American economic system were allowed to function without massive debt expansion. Remember, the annual ratio expander of 0.04956 represents the optimum growth factor available in America today because it's based upon state of the arts technology and the current population base. When today's actual expander is subtracted from the parity expander, a loss of almost 2/3 of our potential growth is isolated.
AN OVERVIEW
The formula that defined the relationship between raw materials income and National Income wasn't mathematically proven until the mid-1930's. During that period, the National Income was found to increase and decrease in direct ratio to the increase or decrease in raw materials income. Sadly, our society had to lose 1/2 of its National Income during a 10 year depression to uncover this fundamental cause and effect.
The original formula of Raw Materials Economics was only discovered after a sea of private debt was eliminated through bankruptcies, foreclosures, and deflation. Then, a much smaller core production cycle appeared, completely intact. It was a terrible price to pay to find a natural order within the economy.
Following that period, a law was passed that maintained the agricultural portion of raw materials prices. It was known as Senate Joint Resolution #60. It was sponsored by Senator Ellison B. Smith of South Carolina, and was signed into law by President Roosevelt on May 26, 1941. It raised the floor under the price of storable commodities to 85% of parity. The Steagall Amendment soon followed. It was an amendment to the Emergency Price Control Act of 1942, and was passed on October 2, 1942. It raised prices of farm commodities to 90% of parity, and added semi-storable crops such as milk and eggs to the list. These laws remained in effect until 1952. They still provide us with a historical touchstone.