Chapter Nine
Raw Materials Prices and Reciprocal Markets
"The primary and fundamental occupations, which create a demand for all others, are evidently those which extract wealth from nature" from Progress and Poverty, by Henry George.
 This chapter explains how raw materials, through their price structure, and volume, determine the amount of reciprocal markets within the annual production cycle, the price and value of all finished goods and services, the price and value of skilled labor, and ultimately the nation's standard of living.
YOUR NEW HOME (Forestry)
Many reciprocal markets surround the construction of a new home. If you decide to build a home, you must first buy the lumber and other materials (most likely through a contractor) after securing a loan with a suitable lender. All your building materials originated on the land and reflect the end of a long production cycle. Before building materials became available, a forest of commercial trees was nurtured to maturity, and a logging company harvested and delivered the trees to a saw mill. This required labor and expensive machinery.
Lumber could only be delivered to the home site after trees were grown and harvested, and a mill was built and operated by skilled laborers. The owner of the logging company and the owner of the mill placed a borrower's demand on capital, a producer's demand on labor, and a business demand on manufacturing before construction could begin. Many people, including you, were put to work building your home, or earning the money for a down payment, long before you considered a new home.
Some of the people who contributed to your home construction project are almost invisible, but very important. They build trucks, trailers, fork! lifts, chain saws, the roads and bridges the logging company uses to bring logs to the saw mill, as well as the roads and bridges the saw mill uses to ship finished lumber to the lumber yard. Each of these businesses acquired a full line of machinery and skilled labor, before the first piece of lumber was delivered to your new home site.
Those who labored for any of the companies that supplied the logger and saw mill were rewarded before either the logging or milling company collected a dollar from the sale of wood. In other words, these raw material companies bought and paid for your building materials long before you decided to build a home. This is how raw material operations create jobs, wages, and the profits that eventually form the capital pool from which you borrowed the money to build your home. Stated simply, raw material operations initiate the production cycle that provides the jobs and domestic wealth necessary to create the consumer income that'!s used to buy the materials and pay the labor to build the home.
The process of producing and processing raw materials into finished goods, "the production cycle" rewards many people. As you see, one of the jobs associated with your home construction project was yours. This is how a functional reciprocal market is created and sustained.
STRUCTURAL PARITY
These reciprocal domestic markets can only be optimized when the value of raw materials is sufficient to pay the retail price of all the raw material production inputs needed for the next production cycle. The maintenance of this price equilibrium creates optimal volumes of reciprocal consumer income and therefore generates maximum distribution while reducing the need for consumer borrowing.
The restoration of this balance is necessary if the profitability of the private enterprise system is to be restored. This balance is called "parity." This parity defines the income level necessary to maintain diversified business organizations while maintaining the intrinsic value of skilled domestic labor at every stage of the production cycle, so labor can consume its own production. As this parity value flows through every stage of production, distribution, and consumption, it establishes the price floor under all consumer items. This parity is a pre-requisite to the development and maintenance of reciprocal markets and ultimately Domestic Wealth.
A parity balance or parity exchange equation is a necessity if goods and services are to be consumed without adding debt to the economy.This natural reciprocity is also applicable to oil and gas production.
THE OIL PATCH (Mining)
Oil is another raw material that creates jobs and income across all regions and socioeconomic classes, but it's full potential has never been !reached because the value of oil is kept artificially low. This has a negative impact on the economy and the world's environment.
Oil and gas production share a similar production cycle with lumber. Like lumber, the first stage for jobs in the oil patch (or the primary demand for labor) is created from the land, when the oil company signs a lease, usually after a thorough geological study is made of the proposed drill site. This study is usually purchased by the oil company from a separate geological company to reduce the chances of drilling a dry hole. When the geological company approves the drilling location and the bonus payment is made to the landowner for the prospective acreage, a second stage of jobs are created.
This second stage of jobs begin with the hiring of a drilling contractor. This contractor has already purchased a wide range of specialized equipment, and when the drilling begins, the contractor must pay skilled workers for non-stop 24 !hours per day labor until the drilling is finished and production pipe is cemented into the hole to protect underground fresh water supplies.
A third stage of jobs and economic activity is generated by service and supply companies that provide surface production equipment, together with down hole equipment and supplies.
Finally, a forth stage of jobs is created if the well is considered a "producer". Since oil lifting or harvesting operations occur over the long term, a crew of skilled workers from an oil and gas operating company must be hired to operate the well and produce the oil and/or gas for many years. Thus, new wealth has been created from the land.
During the active life of the well, monthly royalties are paid to the landowner which generate local income from the land. This new wealth is devoid of debt expansion.
After the oil and/or gas is produced, it must be transported to one or more elaborate processing facilities where it is refined into products such as gasoline, diesel fuel, dry natural gas, heating oil, lubricants, plastics and other petrochemical products that are used everyday. This generates more jobs.
Domestic oil and gas production creates jobs across the economic spectrum from production and distribution, to wholesaling and retailing. Oil produces wealth from the land for every community in America. If oil stops flowing, America stops moving! This knowledge begs a question. How long can Americans underpay their domestic producers of oil.
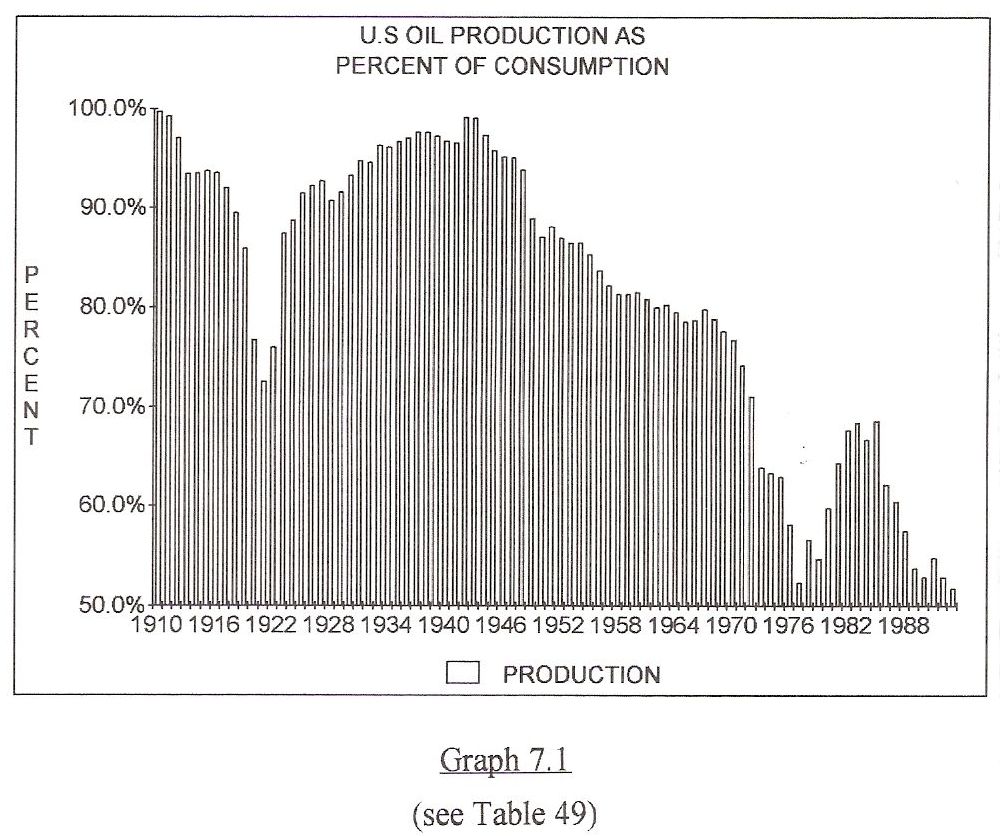
Graph 7.1
Federal policies have allowed this important natural resource to be exploited. Today America imports 50% of all oil consumed. The "story of oil" can be summed up by reviewing the US production of oil as a percentage of consumption. As the Chart shows, America was 95% self sufficient in petroleum production until after World War II.
Until recently, oil and gas prices were kept artificially low. This policy continued until a majority of America's shallow and highly productive oil and gas fields were discovered and consumed. Then, as new production became harder and more expensive to find, the Congress implemented policies that enhanced the importation of cheaper petroleum and attempted to pay the bill by exporting military hardware and grains.
If oil prices were allowed to increase, it would generate exploration profits for individual proprietors, corporate profits for oil companies, and rental incomes for land owners. This new money would multiply inside America and generate more purchases of domestic consumer items from the increased utilization of skilled labor. These higher prices would also stimulate the growth of renewable energy sources.
The oil boom of the late 70's and early 80's created new jobs and income for many Americans. Subsequently, America became almost 70% self sufficient in energy production.
In 1983, 84, & 85, oil production and price found an equilibrium, or a level of parity because American oil companies were producing more domestic oil and gas each year as a percentage of total demand. This occurred while the higher value of oil and gas generated new conservation measures that decreased consumption by over 1 Billion Barrels per year. In essence, the oil shortage was correcting itself.
Projections on Table 49 indicate the American energy situation is not beyond help. By gradually re-indexing oil prices to the levels of 1983-84-85, America will slowly regain energy independence while creating incentives that enhance conservation and expand the use of alternative energy sources.
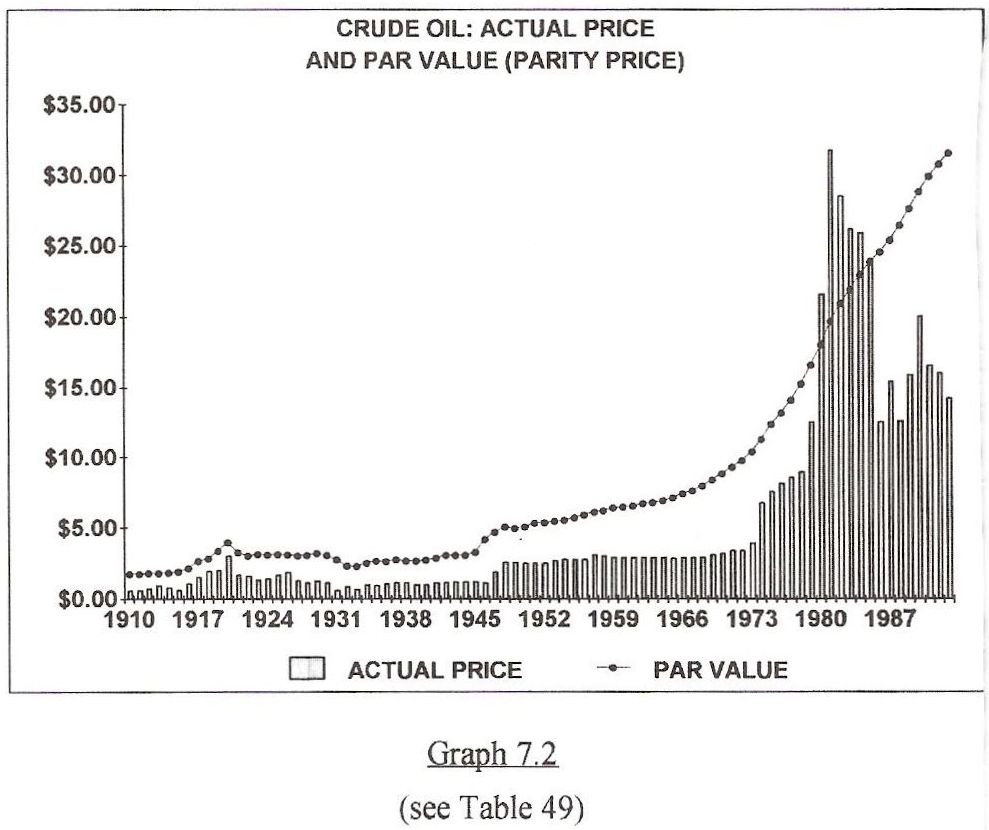
Graph 7.2
This period of oil and gas parity can be referred to as a period when the oil economy experienced equity of exchange with the national economy. That is, the price of oil and gas at the first point of sale joined the volume of oil and gas produced domestically to create a greater degree of energy independence while creating jobs and new income for many Americans. Due to misguided public policies such as the changes in tax laws in 1986, America lost the benefits of that brief period of balance.
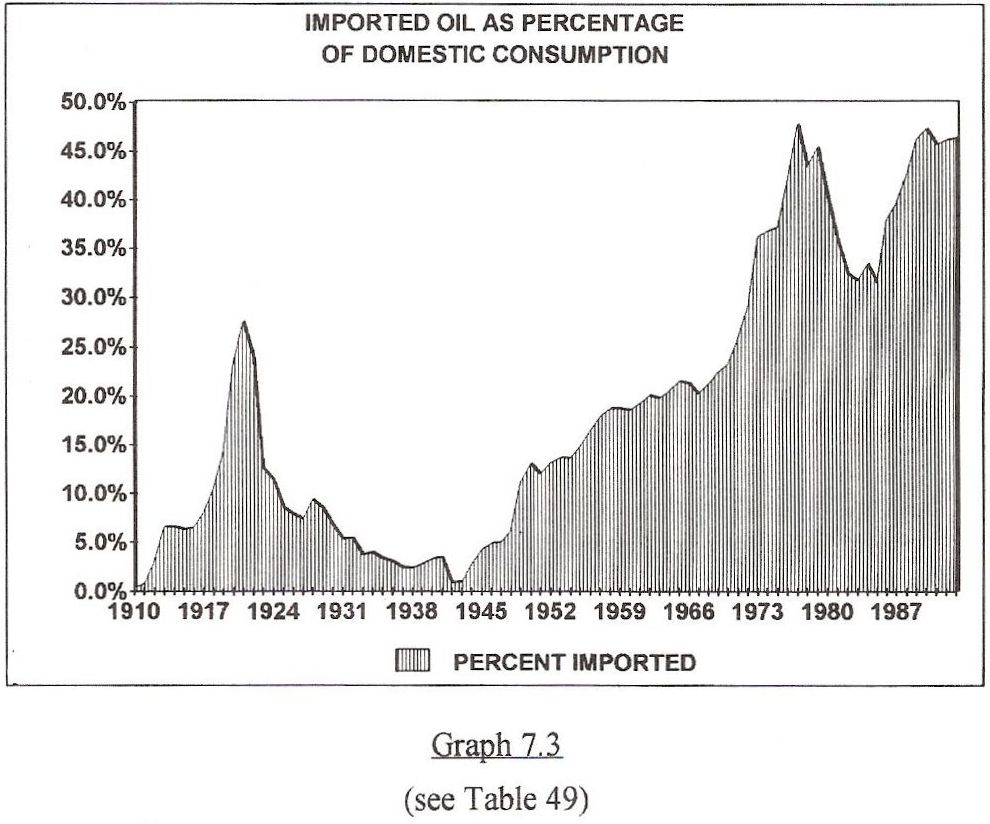
Graph 7.3
Americans have paid a high price for imported energy in terms of jobs and income lost. This money should have been earned by other Americans. By some estimates, the cost of military power to defend the right to purchase supplies of foreign oil from the Persian Gulf exceeded $100.00 per barrel at 1994 prices. There is no free lunch in terms of producing any! necessary raw material, only the method of payment changes!
America's growing dependence on oil imports has robbed over 1 million permanent jobs and the rental income (royalties) on all the oil imported.
DOWN ON THE FARM
Franklin said wealth could be generated by literally "planting the seed." The seeds that farmers and ranchers "plant" every year generate 2/3 of all raw materials used. They assume the form of food and feed grains, vegetables, cotton and other fibers, and convert to livestock meats and other non-durable consumer goods. Together, these "seeds" generate our economy's most predictable and highest volume production cycle.
America's need to exploit this essential resource can be summed up in the following quote from Kenneth E. Boulding, who was a professor of economics at Michigan State University:
Civilization is what happens in cities, and the city is dependent on there being a surplus from the food producer, and on some existing organization which can take it away from him. With this food surplus, the political organization feeds kings, priests, armies, architects and builders, and the city comes into being. Political science in its earliest form is the knowledge of how to take a food surplus away from the food producer without giving him very much in return.
The previous charts and graphs have displayed some very disturbing trends that impact business and labor in both rural and urban America. These trends were primarily caused by a declining level of profitability. One-half of the lost profitability of private enterprise originates from a loss of net farm income. This loss has worsened over the past two decades and has now become a systemic loss to the entire left side, or the profit side of the T-chart. This became obvious after farm proprietor's income was separated from non-farm proprietor's income, and the remaining farm income totals were reviewed as a percentage of National Income.
EXPORTING OUR WAY TO STARVATION
Sunday morning television commercials wrap farmers in the American flag and brag about their productivity. These commercials promote exports as a method to raise farm income and offset America's trade deficit. These commercials never discuss the cost of cheap grain exports (in the form of U.S. government payments to the grain exporting companies) or the fact that world market export prices destroy profits for the American economy.
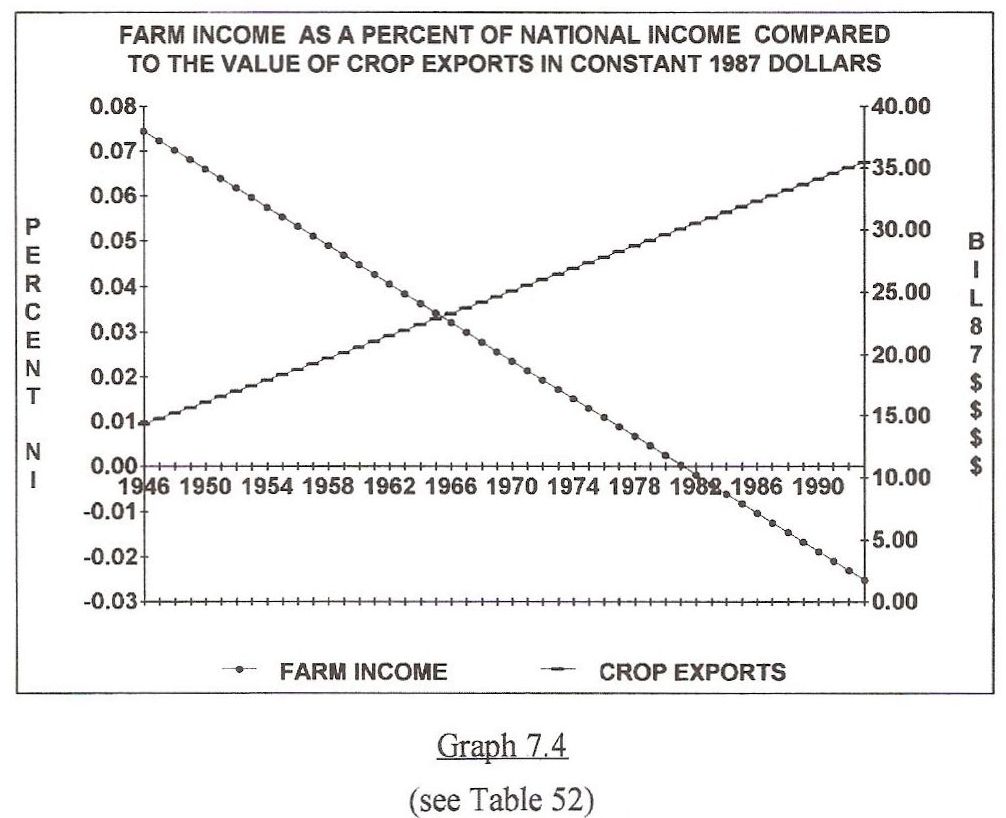
Graph 7.4 places exports and farm prices in perspective. America's 50 billionth bushel of corn was exported during 1993. This export oriented farm policy forced the world price of all grains so low that it destroyed the historical percentage of National Income that should have flowed from farming, a necessary profit producing segment of the economy. At the same time, these low prices forced other nations to support their farmers with more subsidies.
Graph 7.4
Increased exports have occurred at a net loss to the American economy. More than one-half of all macro economic profits lost in recent decades originated as lost net farm income. These losses can't be offset by producing greater volumes of grains for export at lower prices. In fact, these losses have been exacerbated by producing greater volumes of grains for export at lower prices.
Maintaining the profitability of any industry by increasing output can eventually become self-destructive. This is the situation with agriculture. In the past, farm profit!ability could be maintained through increased levels of productivity if productivity increased faster than out of pocket costs. These costs excluded damage to the soil, the environment, and the increased medical cost resulting from a diet of chemically enriched and processed food.
Agriculture has hit a glass ceiling regarding productivity because the cost of production per unit of output is higher than the selling price per unit of most commodities at the first point of sale. So, increasing off farm inputs no longer improves farm income.
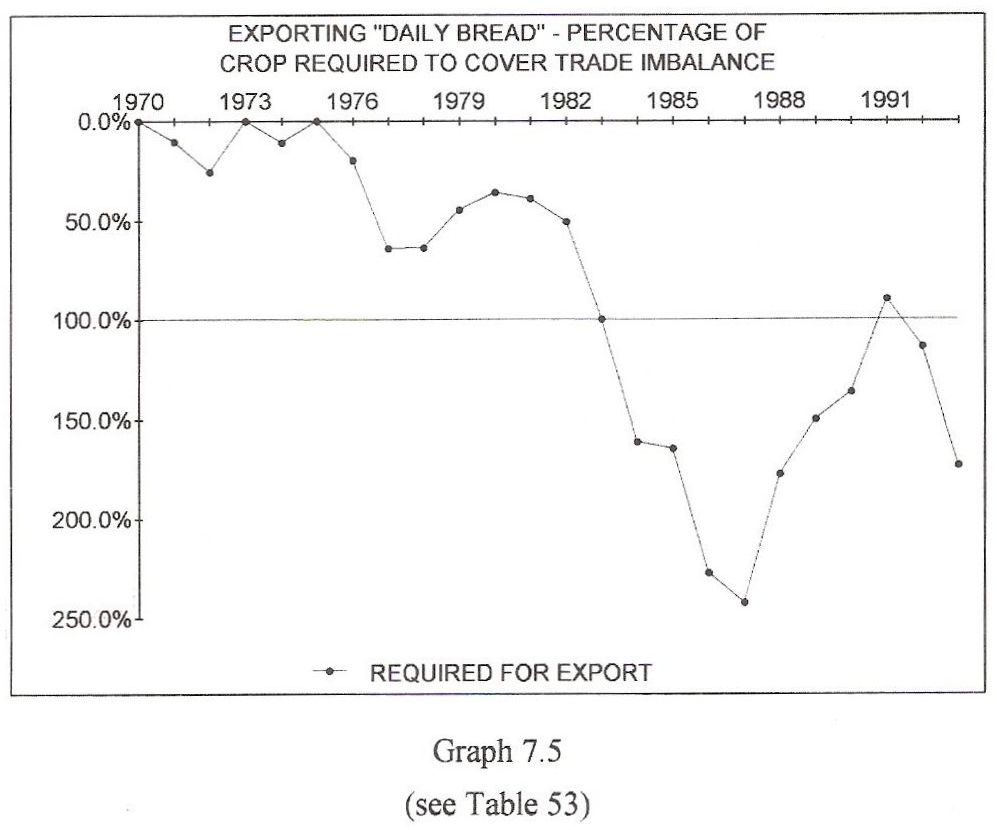
Graph 7.5
During the most recent decade, the price per unit of American crop exports has been so low and the trade deficit so large, that if farmers exported every pound of plant life produced in America for feed, food and fiber during the years 1984-1993, (everything but the livestock) America would have been left with a 449.9 Billion Dollar trade deficit for that period! while the American public and most of America's livestock starved.
Graph 7.5 places exports in perspective. There are two alternatives to the present system. Either raise farm prices so they reflect the intrinsic value of production, or import food from developing countries where quality control is impossible.
The records on exports, prices and income are self explanatory. America's export oriented farm policies function at the expense of the American people.
BEAM ME UP SCOTTY
A prosperous food and fiber production system that's based upon domestic sales creates a paradox for those convinced that more efficiency is achieved by continuously maximizing the number of units produced for the least cost per unit of production. This logic ignores the necessity to maintain balanced price levels across the production cycle. It is easily discounted because the trend lines flowing from distorted efficiency finally reflect a system of total production at NO COST, like the food replicators on the 24th century star ship Enterprise. These food replicators appear to create food out of thin air, costing only the amortized cost of the devices and the energy to power them. Thus far, they only exist as a figment of TV writer's imaginations. Obviously, in today's world, other factors such as an equal exchange value between raw materials, factory goods and wages must be considered as urban America exchanges its labor and production with rural America.
A PIVOTAL ROLE FOR AGRICULTURE
America's food and fiber system makes the largest single contribution to the annual production cycle and to the development of reciprocal domestic markets. This contribution is replaced by debt when farm prices are not at par with the cost of domestic labor and American produced consumer goods. This phenomena is repeated when !other raw materials are under-priced. Calculated from 1958 through 1991, a total parity value of all raw materials was 16.7 Trillion Dollars. This raw materials value should have been earned. Instead, only 6.04 Trillion Dollars in value was earned. This lower value was supplemented by 11.3 Trillion Dollars debt expansion; causing the combined value of raw materials and debt to total 17.3 Trillion Dollars. This illustrates how debt is substituted for earned value at the beginning of each production cycle so the economic system can produce and market products and services.
The value of any raw material product establishes the first value in the production cycle and therefore establishes a floor under prices for goods and services at subsequent stages of the production cycle. Therefore, any shortfall between the intrinsic value of production and the actual price paid for production, determines th!e amount of debt necessary to supplement the economy at those same stages of the production cycle. As a result of this natural governing structure, the annual par value, (the hypothetically correct level of raw materials income), will always approximate actual raw materials income plus net debt expansion. This is a natural framework within the economy. Thus, raw material values set the volume and value of employment, or the level of debt that must be added to maintain employment during any year, and subsequently the amount of goods and services distributed and consumed, or the amount of goods and services that remain in surplus during any year.
APPROPRIATE FARM PRICES
The optimal price for food, fiber, or any raw material at the first point of sale is a price that maximizes a raw material's employment producing potential. This price level produces maximum reciprocal domestic markets with a minimum of debt expansion.
Table 54 displays the total farm production delivered to urban America since 1947. Column A, demonstrates the doubling of farm output since 1947. Column B shows no increase in gross farm income through the period. Since 1947, farm output has grown steadily, but the annual per capita payment to farmers by consumers for food and fiber production has dropped by one half in terms of constant dollars. Thus, every pound of food and fiber above the 1947 level of production has been delivered to an additional 108.6 million consumers without paying producers for the increased production.
A BARGAIN AT ANY PRICE
Imagine buying a new 2000 square foot home for around $5000.00, or a new full size automobile for $1200.00. That's the equivalent of today's farm prices. This bargain seems impossible, when compared to other retail it!ems. However, cheap farm prices are an illusion. The cheap prices paid for food and fiber excludes the debt required to subsidize low prices and remember, the bill for the accumulated underpayment remains outstanding.
EFFICIENCY OR EXPLOITATION
Real increased efficiency can result from improved crops and livestock genetics and high tech machinery. This gradually lowers the net farm income component of National Income. In recent decades however, public policies have eliminated net farm income and replaced this income with debt expansion. This is exploitation, not efficiency.
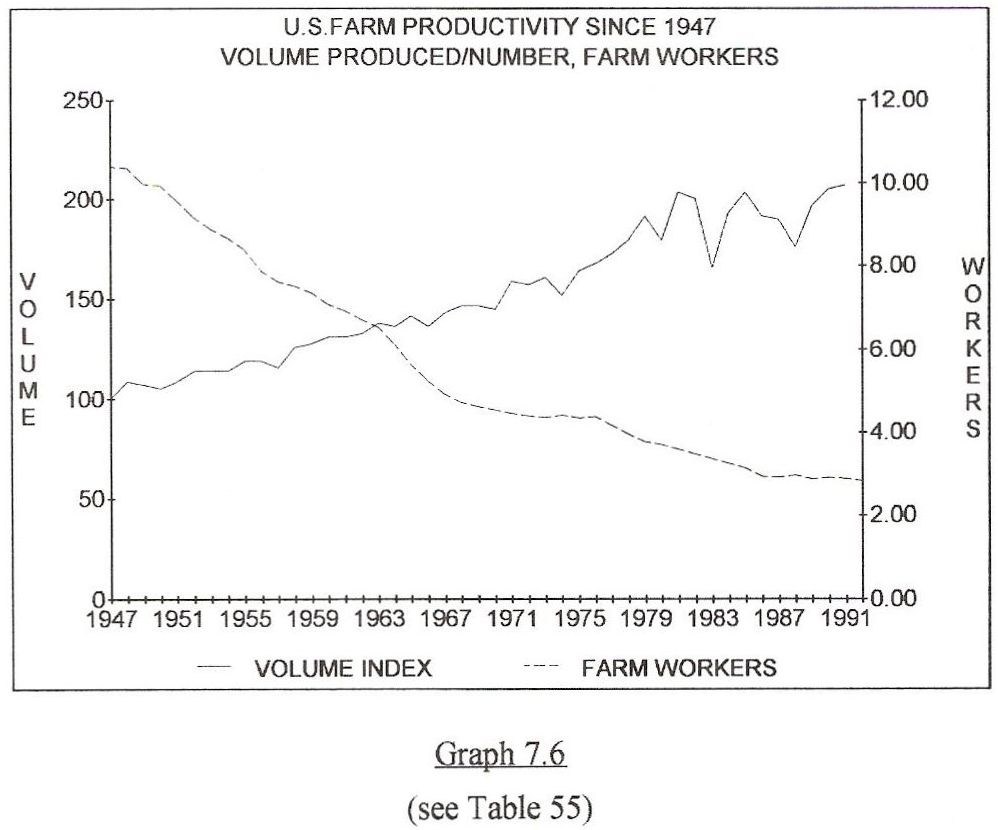
Graph 7.6
Since the early 1950,s a shrinking number of farmers have been forced to double their output with no additional income while purchasing off farm inputs at full retail. These inputs contained a labor cost that! farmers couldn't pay without additional gross farm income. A majority of gross farm income, or any other gross raw materials income is the first income allocated to urban America at the beginning of each production cycle. This causes cheap farm prices to be an illusion.
Since the early 1950's, gross farm income has remained constant while all other segments of National Income have increased. Many farms consolidated in a futile attempt to compensate for lower prices. They used less labor, and produced higher yields. In the past 50 years, 5 million farmers were forced out of business by this process, while the remaining farmers incurred more debt to generate a shrinking share of urban America's reciprocal markets.
Over time, these policies created structural unemployment by removing productive farmers from the land and sending them to cities where they stopped producing food, and instead produced a! surplus of urban labor. This occurred because policy makers misunderstood the cause and effect of low farm income.
THE TRUTH ABOUT FARM INCOME
For decades, organizations such as NORM. (National Organization for Raw Materials) have warned the U.S. Congress and the American public about the consequences of forcing farmers and other raw materials producers out of business. Today, this forced attrition produces systemic problems across the economy by retarding economic growth, increasing budget deficits and contributing to structural unemployment.
Representatives of NORM have testified in countless hearings that the destruction of raw materials income destroys the purchasing power of other economic sectors. This eliminates skilled jobs and reciprocal markets in urban America.
The following tables and graphs depict a systematic underpayment for wealth at the point of origin. They prove that every acre of productive farm land is yielding less purchasing power every year. This loss of purchasing power is occurring at the first point of sale of America's new wealth. The following examples cover America's largest field crops; wheat, corn and cotton.
HIGHER YIELDS AND LOWER PRICES
{Prices calculated in constant 1987 dollars [inflation removed]}
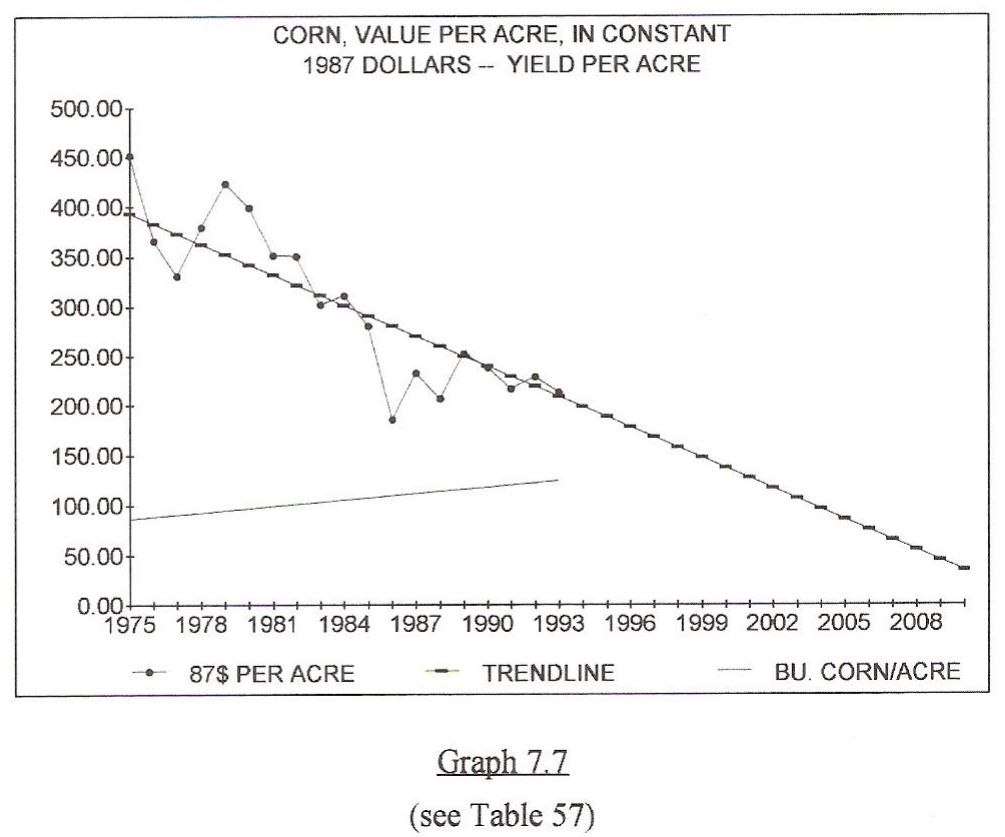
In 1980, 1981 & 1982 corn yields averaged 104.3 bushels per acre and the average gross value per acre of corn was $366.74. In 1993 corn yields averaged 100.7 bushels per acre and the gross value of an acre of corn had fallen to $213.21. This reflects a 3.5% drop in yields and a 41.9% decrease in gross income per acre. 1993 was a poor crop year for corn, but a single year doesn't alter the long term trend. Graph 7.7 offers a longer history.
Graph 7.7
Since 1975 corn yields have increased by an annual average of 2.09 bushels per acre while the actual value of each acre of corn fell by an average of $10.24 per acre each year.
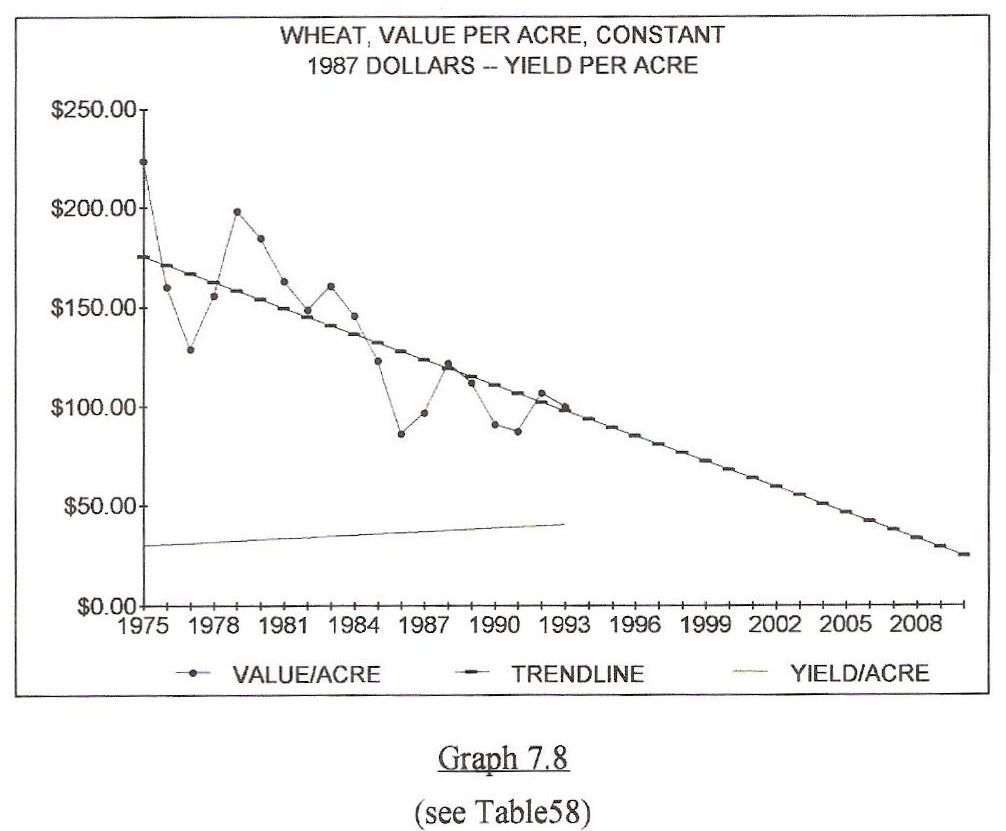
Graph 7.8
The value of wheat has also fallen each year. In 1980, 1981 & 1982 wheat yields averaged 34.5 bushels per acre and gross income per acre averaged $165.35. In 1993 wheat yields averaged 38.3 bushels per acre and the gross value of wheat had fallen to $99.80 per acre. In other words, wheat yields increased by 10% over the decade while gross income per acre of wheat fell by 39%. A 20 year trend reflects a similar situation. Since 1975 wheat yields have increased by .57 bushels per acre per year (about 1/2 bushel per year). However, during the same time, the value of an acre of wheat declined by an average of $4.30 per acre per year.
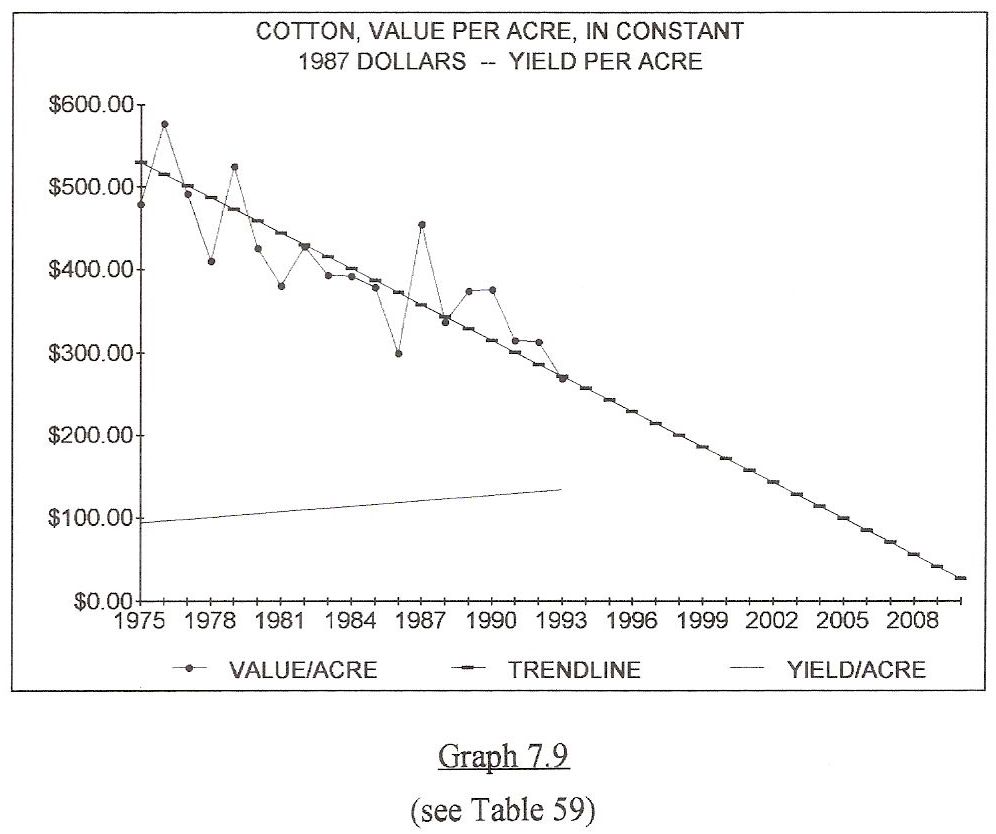
Graph 7.9
The cotton income situation is similar to that of wheat and corn. In 1980, 1981 & 1982 cotton yields averaged 512 pounds of lint per acre and the gross income per acre of cotton averaged $410.51. By 1993, cotton yields had increased to 607 pounds of lint per acre but the gross value per acre of cotton had fallen to $268.40. Stated another way, cotton yields increased by 15.7% per acre while the gross income per acre of cotton fell by 35%.
A 20 year trend offers similar results. Since 1975, cotton yields increased by an average of 10 pounds of lint per acre per year while the value of an acre of cotton fell by $14.35 per acre per year.
In each example, low farm prices have caused farm income to drop so significantly that increased yields could not compensate for the! loss. This loss of purchasing power eventually became a direct loss to urban Americans who didn't receive adequate income from the inputs farmers purchased to produce the food and fiber. Regardless of this lost income, the same urban Americans were expected to maintain their patterns of consumption.
SUBSIDIES
In 1993 the corn crop lost an average of $17.05 per acre even after 1.4 Billion Dollars in subsidies were included. The 1993 wheat crop netted only $8.05 per acre after 1.938 Billion Dollars in subsidies were paid. The 1993 cotton crop netted only $5.85 per acre after 1.557 Billion Dollars in subsidies were paid. Each dollar of subsidy increased federal deficits by an equal amount but didn't offset the effect of low farm prices.
1993 prices were so low that the corn crop lost $36.15 per acre without subsidies, the wheat crop lost $21.67 per acre without !subsidies and the cotton crop lost an all time high of $115.49 per acre without subsidies.
Farm subsidies accelerate the deterioration of farm gate prices, exacerbate budgets deficits, and destroy earned National Income.
Reduced gross farm income caused farmers to forgo purchases that should have added 988 Billion Dollars to farm expenses since 1975. This lost purchasing power rippled through the economy forcing others to lose income and forego purchases.
The ripple effect from this lost purchasing power reduced the normal growth of National Income by a total of 6533.9 Billion Dollars since 1975. This suppressed living standards, created structural unemployment and built up unnecessary commodity surpluses which the Government paid the private sector to export while 26 million American citizens (1 out of 10) received food stamps to consume cheap food. Low farm prices destroy the purchasing power of urban America. This leads to higher unemployment, more poverty and false surpluses caused by under-consumption.
A FAIR PRICE
The solution to the chronic depression in rural America and the structural unemployment and repeated recessions in urban America must begin with a major increase in the value of farm and other raw materials to balance with the cost of wages and interest.
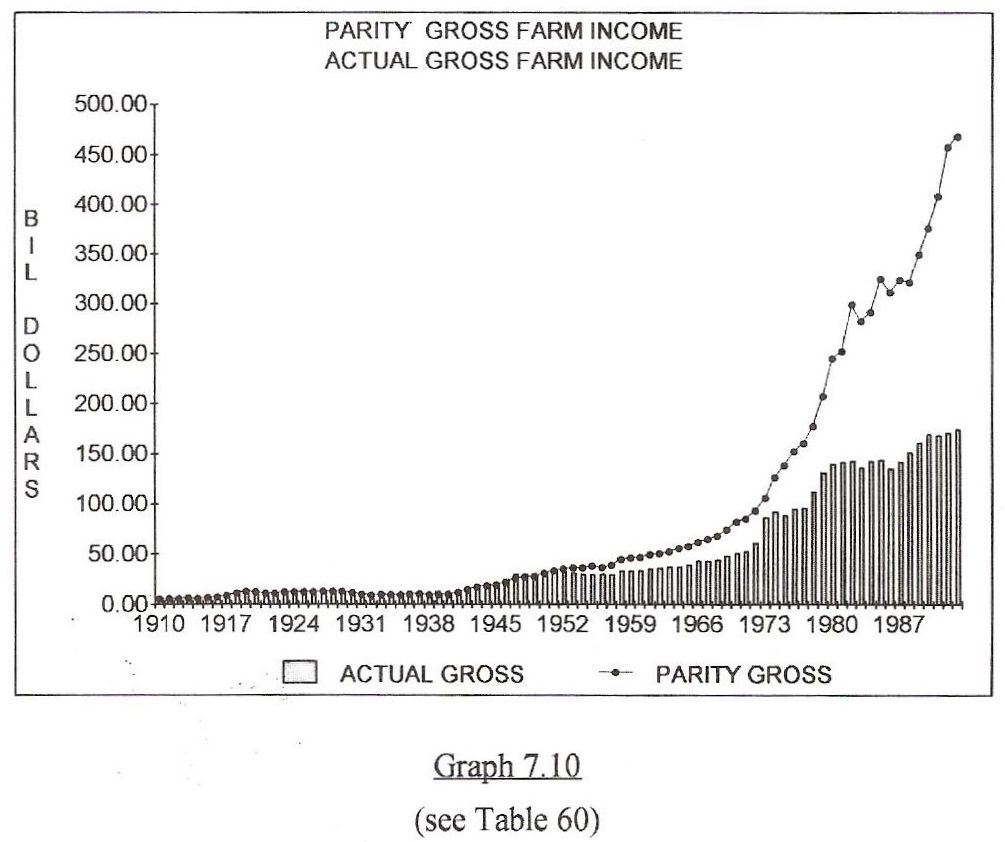
Graph 7.10
Graph 7.10 reflects the farm income necessary to optimize reciprocal markets. The top line on the Graph shows the income which would have been earned by rural America if prices for raw materials remained constant every year in terms of the retail prices of production inputs. The bottom line reflects actual purchasing power which was much lower.
Gross cash income in 1992 for all agriculture production was 175 Billion Dollars. If farm income had kept pace with the prices farmers paid to urban Americans for retail inputs, agriculture would have generated 364.6 Billion Dollars of gross cash income in 1992. This is a shortage of 179.6 Billion Dollars for only one year.
This is lost barter power between rural and urban America. It was lost because it was not earned into circulation. This shortage occurred at the foundation of the economic cycle. It was replaced by under-consumption, unemployment, and debt expansion.
In recent years, increasing amounts of off the farm income were necessary to replace decreasing government subsidies and crop values. This maintained agriculture productivity and therefore America's food supply. The labor income that should have been earned from agriculture production was actually earned by farmers and ranchers from their labor off the farm. This allowed farms to operate without paying the farmer's labor. In order to continue operating, active farmers were forced to take jobs and income from urban workers. This eventually caused the general rate of unemployment to go up because it displaced new urban workers. This is significant because it again shows that cheap raw materials are an illusion. Only the method of payment changes. When public policy takes income away from farmers, they go to town and take income away from urban sectors, forcing pain on both groups. This negative reciprocity can't be ignored.
The first stage of demand begins on the land, when the production of raw materials creates the demand for the retail inputs needed by raw materials producers. That demand produces primary income for urban America. That demand must be met through the use of debt or earned income, or the society loses barter power. Without sufficient urban inputs, raw materials producers can't bring enough new land based energy (both metabolic and kinetic) to the urban market to match the ever growing population. This primary demand for inputs employs and pays much of urban America before "the seed" can be planted.
The cause and effect between farm income and National Income is illustrated in numerous government statistical publications. These publications present records that tell the following story. Since WWII, the profits of private enterprise have fallen by approximately 50%, from roughly 1/3 of National Income to about 16% of National Income and over one-half of this loss can be statistically tracked to a loss of farm income.
THE NUMBERS
Income generated by farm proprietors during the base period of 1947-49 averaged exactly 7% of National Income. From 1980 through 1992, surviving farm proprietors earned less than .07% (seven-tenths of !one percent) of National Income. Today, a full decade of net farm income is needed to equal a single year of base period net farm income. One-half of the lost profitability of the American private enterprise system is the lost profitability of agriculture!
Table 61 reflects the current economic situation in rural America. The table illustrates that when living expenses are deducted, production agriculture has sustained losses in all but two years since 1968, even after government payments are included. Column E shows that farmers, through their operating losses, have been forced to compete with the urban population for jobs.
The cost of farm operators (which is a farmer's family living expenses or payment to the farmer's labor) is ignored by the USDA. It's not deducted from published net farm business income numbers. This allows the Congress to avoid the real truth about farm income.
The standard farm business income measurement assumes that farmers can pay living expenses out of their business profit or their residual income. This logic is not used by the Department of Commerce regarding corporate profits that are calculated after all wages and salaries are subtracted. This includes the million dollar salaries of Fortune 500 executives.
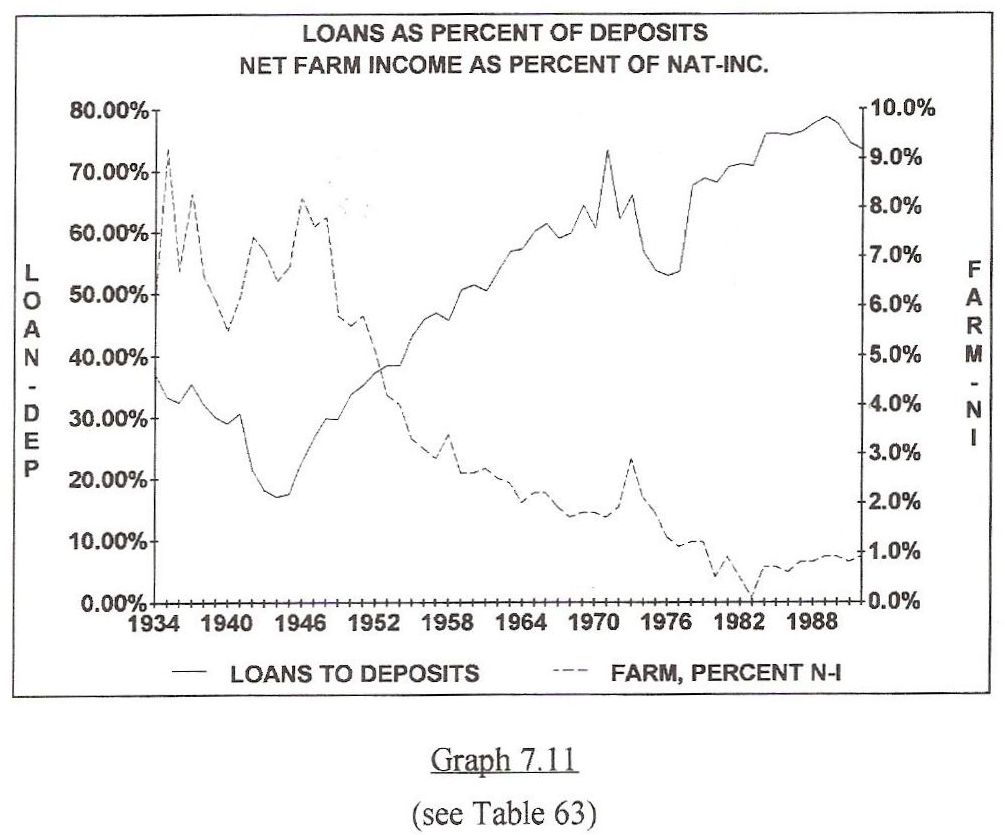
Graph 7.11
Graph 7.11 compares net farm income levels to bank loans as a percentage of deposits since 1934. The loans are a total of all loans and leases and deposits are all deposits held in commercial banks. The farm income line represents the net farm income portion of Proprietors Income taken from the left side of the T-Chart expressed as a percentage of National Income.
The data for this graph was provided by the Federal Reserve Bank of Dallas.! Bank loans as a percentage of deposits are compared with the percentage of National Income earned by farm proprietors. The comparison shows that a direct relationship exists between loan demand, and net farm income which in turn, is directly affected by agricultural and other raw materials commodity prices.
From the perspective of Raw Materials Economics, loan demand must increase as the annual earnings from new wealth industries decreases. Several dramatic examples of this relationship are apparent on the graph. The first of these occurred as America was recovering from the great depression and farm prices reached parity levels. Since some of this can be argued as a war economy, please review the years before, during and after WWII for correlation and causation.
In 1935, net farm income increased and loan demand dropped. In 1936 net farm income dropped and loan demand increased between the years 1936 and 1937.
Between 1936 and 1937, net farm income increased sufficiently to lower loan demand from 1937 thorough 1940. However, the drop in net farm income in 1940 caused an increase in loan demand between 1940 and 1941. During WWII, net farm income continued to increase and loan demand decreased. Between 1945 and 1946 the reverse effect took place.
Since those years can be discounted as war driven, please look at two other periods that show causation between low raw materials prices and increased borrowing.
In the early 1970's farm commodity prices increased causing net farm income to peak at approximately 3% of National Income. When net farm income increased, loan demand dropped shortly thereafter. As net farm income fell in 1977, loan demand increased. Closely examine each line of the graph. Both lines returned to their long term trends after the 4 year "spikes" that were led by higher net farm income in the 1970's. !
The most recent of these examples occurred during the early 1980's when net farm income was allowed to completely disappear. This drop was followed by a peak in loan demand that reached almost 100%. As net farm income recovered slightly, loan demand decreased once again proving the pattern. When new wealth is not given adequate monetary value, debt must compensate.
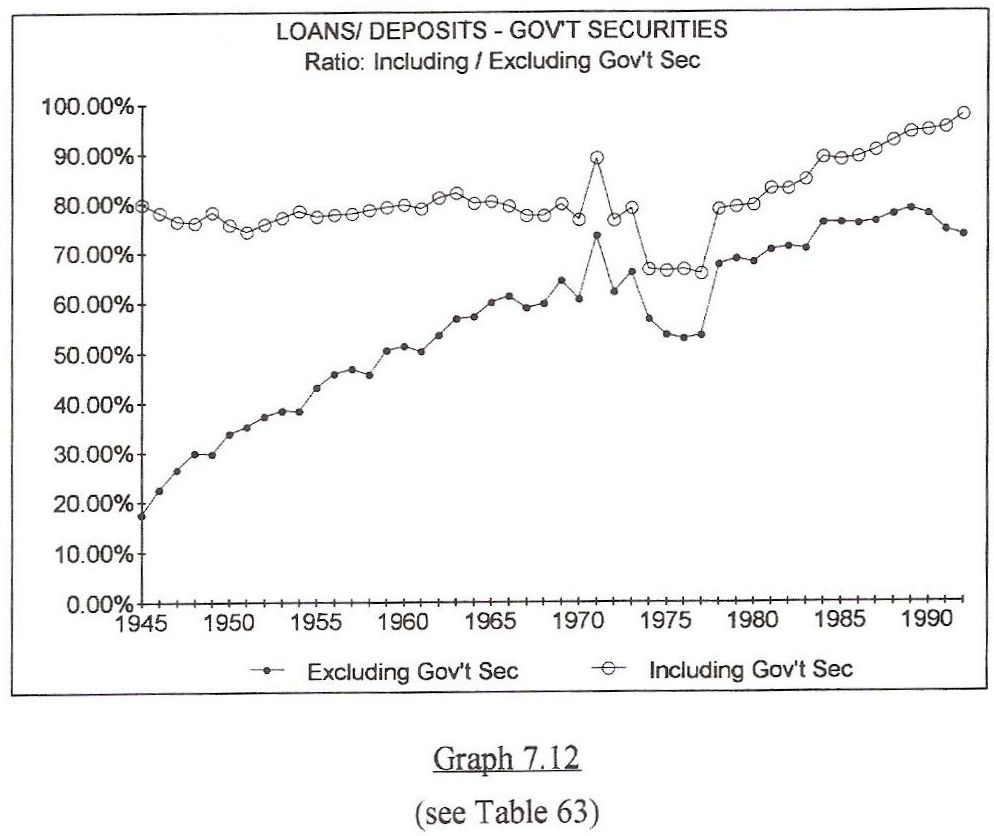
Graph 7.12
Graph 7.12 compares the percent of loans to deposits in two forms. The top line displays loans to the federal government (the purchases of government securities), plus private loans. The bottom line displays loans as a percentage of deposits excluding government securities. Both lines dropped when net farm income increased during the 1970's, and loan demand increased! to the previous level when net farm income fell.
In recent decades, the concept of wealth originating from the "seed" or from the beginning of the production cycle, has been ignored because most Americans are eager to capture the "good life" as white collar workers in the service sectors of business.
Generally speaking, when people are separated from the land by two or more generations, they develop naive and nostalgic misconceptions about the significance of natural resources and about the role of natural resources in their lives. This is not a criticism, but an observation.
Hopefully, the Tables and Graphs in Chapter 9 have replaced this romantic perspective with statistically based pragmatism.