Perhaps the absence of difficulty of securing raw materials by those countries where raw materials grew and flourished was yet another reason for economists to remain blind to this crucial economic factor. Not even the wars these same nations fought for the control of the world's natural resources awoke economists from their slumber. The Entropy Law and the Economic Process by Roegen.
Chapter Ten
Raw Materials Economics
 After peeling back the layers of misconception and half truths concerning money, debt, trade, production, and wealth, it should be obvious that cheap food, energy, and labor won't fix the economy. No wage concession, tax bill, budget reduction act, free trade agreement, short term stimulus package, or program to reduce government spending can fix the economy because these actions don't maintain the value of domestic business and labor, which is a prerequisite for restoring the profitability of the American private enterprise system.
The Keynesian economic philosophy of borrow and spend is flawed because it's non-sustainable, as is the supply side trickle down theory of the 1980's that piled debt upon everyone except the wealthiest Americans. America's unilateral approach to free trade is flawed because it destroys the purchasing power of labor. America's debt based monetary system is flawed because it devours the profits of the private enterprise system.
Today's popular approaches to sustained growth and prosperity are all flawed. However, real change that sustains prosperity and growth, won't win any popularity contests. The most fundamental of these unpopular changes require the monetization of raw materials at the first point of sale and the gradual elimination of excess debt expansion.
These changes will build the framework for balanced price levels between all goods and services exchanged within the universe of National Income. This is a real prescription for a prosperous economy. This long term cure will maintain the profits of private enterprise at a normal level equal to 1/3 of National Income before taxes so optimum distribution can occur, without the necessity for continuous debt expansion.
On the profit side of the equation, new balanced price levels will reflect the net intrinsic value (measured in dollars) of the metabolic and kinetic energy in all items of commerce.
On the cost side of the equation, new balanced price levels will reflect the intrinsic value of energy, both metabolic and kinetic, expended as physical work and diligence to produce products and services.
This balance is a cornerstone of Raw Materials Economics. The proper rate, or velocity, of this restoration is mathematically measurable. It requires many gradual changes in public policy.
Raw Materials Economics recognizes that Nature Credits A Society With New Wealth In Perpetuity And Humanity Debits This New Wealth In Perpetuity.
THE BARTER POWER OF NATURAL RESOURCES
The production cycle is a barter system that begins when raw materials producers become consumers by purchasing the retail inputs necessary to produce raw materials. These raw materials are processed and manufactured, and become all tangible items of commerce for exchange.
This production cycle is filled with reciprocal markets that produce the succession of demand for all essential goods and services. This interdependent structure must produce a sufficient level of income to purchase and consume the retail goods and services it generates. For this to occur without excessive debt, it's essential that price levels be maintained at all stages of the production cycle.
"Optimal" price levels are not subjective. They are measurable and predictable. They reflect state of the art productivity that's a product of technology and population. Most importantly, optimal price levels are sufficient to gradually increase the living standard of a society. If too many prices fall short of this natural price, the economy becomes out of balance at all stages of the production cycle, and excessive debt is created so consumption can occur, or unemployment and surpluses will accumulate.
ESTABLISHING PROPER VALUES
What is a correct method for calculating a fair value for physical production? What is the appropriate price for agriculture, forestry, fishing, mined and recycled products? Can such a value be accurately tabulated? Does this value change each year with inflation? Can consumers "afford" to pay higher prices for this "metabolic and kinetic energy;" their food, fuel, building materials etc.? Does this "fair price always guarantee equity of exchange?"
A fair price for physical production at the first point of sale can be established by calculating the level of income paid to raw materials producers at wholesale that will optimize their ability to buy inputs from other sectors of the economy at full retail without creating capital debt in the process. This retail price for inputs must be sufficient to pay the wages of skilled workers at their parity labor value. Retail prices for inputs that don't include this adequate labor value (such as cheap imports) will short circuit this mechanism.
The first point of sale for agriculture is the farm gate, for oil & gas it's the wellhead, for forestry products it's the sawmill, for commercial fishing it's the landed price, for industrial minerals it's the mine mouth, for recycled products, it's the location of recapture.
When raw material producers are properly paid at this first point of sale, their earnings from production times price at wholesale price levels become the exchange media to purchase the next round of production inputs. If too little money is paid for raw materials, these producers must utilize debt to purchase their inputs.
Raw Materials Economics demands that as the production cycle progresses toward retail, the input dollars earned and circulated by private enterprise must flow through the economy paying off production credit at each stage of product development, so all items of commerce can be purchased as finished retail goods by consumers with the incomes they received from their jobs within the various stages of the production cycle. If too few dollars are in flow to represent the actual energy of raw materials in flow, more borrowing must occur or prices fall and production declines.
The total annual parity value of raw materials (or the undervalued raw materials plus net debt expansion) always pass through the production cycle at a dollar value which approximates the total annual volume of money in the capital pool. In other words, total active liquidity always equals total active raw material energy in flow.
Therefore, the raw materials stage of the production cycle is the foundation of America's production times price economic system. It is the source of all savings and the source of all debt free income available for re-investment in the subsequent year.
This concept of the production cycle and reciprocal markets is another cornerstone of Raw Materials Economics.
A BALANCED ECONOMY CREATES MAXIMUM BARTER POWER
The concept of establishing par values for raw materials to optimize reciprocal markets and create a balanced economy requires the rejection of intellectual commitments to the so called "law of supply and demand," because the supply of retail items only occurs AFTER the demand is created by raw materials producers. This establishes a linear production cycle. Demand always begins before the supply of the next round of goods is created. Demand begins when the raw materials producer pays a retail price for production inputs and essential services. That price determines the price per hour for skilled labor and it becomes a foundation under all other non governmental wages and prices during the next production cycle.
A WORLD FILLED WITH NATURES WEALTH
Please make a mental list of the land based raw materials that surround you. If you're sitting at a desk, it's built from wood, or from steel and petroleum products. Your shelter may be a home or an office, but it also contains a variety of materials either mined from beneath the earth or produced from it's surface. Even the paper, ink and fuel that was used to manufacture this book are all products of nature.
At this moment, raw materials surround you. Look at them and consider their source and consider the energy they represent.
This simple exercise demonstrates that all tangible wealth is the energy of nature. It doesn't matter if you're employed by a national brokerage house in the World Trade Center, if you're a Los Angeles based movie director, or if your job is to prevent the destruction of a rainforest, you're inseparably tied to the energy of natures resources. No one can exist without them.
Your response might be: So what! That's too obvious. It's not obvious. This fundamental logic, the logic that defines the origin and value of natural wealth, is ignored by most Americans.
To understand and appreciate the wealth producing mechanisms in raw materials requires a 180 degree reversal from conventional thinking. It's easy to discount raw materials as necessities that are forced upon every stage of business and consumption, and therefore the less paid, the better, or so it might appear. After all, paying less for necessities leaves more money for travel, entertainment and relaxation based endeavors, doesn't it? That assumption would be true if no capital or labor costs were involved in delivering items of finished goods to retail. Please study the following explanation of how raw materials relate to jobs, the expenditure of energy, and the creation of income levels.
PRODUCERS ARE CONSUMERS
When consumer "A" pays less than a fair labor value for goods and services to consumer "B", who also expended labor to produce a product or service, then consumer "B" will obviously earn less than a fair wage from the effort. This forces "B" to borrow to consume, or it causes "B" to abstain from consumption. Likewise when "A" pays more than the fair price for goods and services, "A" must abstain from consumption patterns that should be afforded to "A's" earnings.
This natural reciprocity, or lack of reciprocity as the case may be, repeats itself throughout the production cycle because the entire economy is designed to exchange products and services between producers and consumers. Everyone is a producer at work, and a consumer when earnings are spent. This system must remain in balance.
All white collar positions and blue collar jobs can be found somewhere within these exchanges. All wages, salaries and business incomes are part of a massive reciprocal market created by a production cycle that begins with the retail inputs needed for the production of raw materials and end with the purchase and consumption of retail products.
When any group or "sector" is shortchanged in this process, the entire economy will suffer. As a counterbalance to this suffering, some citizens are subsidized by government and others are allowed to borrow to consume, but synthetic income can never replace value because the debt that produced the synthetic income remains outstanding after the consumption of the product that debt produced.
MONEY FLOWS MUST REFLECT ENERGY FLOWS
When Americans undervalue raw materials at the first point of sale, which again is the metabolic and kinetic energy necessary to mobilize the economy, it short changes the creation of debt free earned income. This income is necessary to make retail purchases of consumer goods without going into debt.
The money earned by raw materials producers eventually creates the money used for retail purchases because the money in flow that originally represented raw material production is the paper representation of the energy in flow through the economy. Therefore, these two ends of the production cycle, one containing the raw materials and the other containing the retail products, are monetarily and physically bonded and the degree of balance between the two either expands or contracts the capacity of the private enterprise system, causing it to create more profit or more debt in every production cycle.
THE INCOMPATIBILITY OF LOW PROFITS AND HIGH WAGES
It is self destructive to undervalue raw materials at the first point of sale while purchasing expensive consumer items, because this price dis-equilibrium slows of the production cycle which retards job creation and economic growth.
Price equilibrium is the final derivative of parity raw materials prices. This absolute (truth) in economics has been lost since our society began floating in an ocean of debt. As a consequence, the Congress establishes policies that expand federal services that further retard and short circuit the production economy.
Services can't live off other services. Services must assist and reward a prosperous private enterprise economy. A service economy based on low profits and minimum wages can't be sustained. Many services, such as entertainment, add to the quality of life. But, if we all decided to be entertainers as a full time occupation, and failed to create any new tangible production, a shortage of food, clothing and shelter would soon develop. In a macro economic sense, America has plenty of entertainment. Now, it's time to concentrate on the fundamentals of social organization.
SERVICES CAN'T SUSTAIN OTHER SERVICES INDEFINATELY
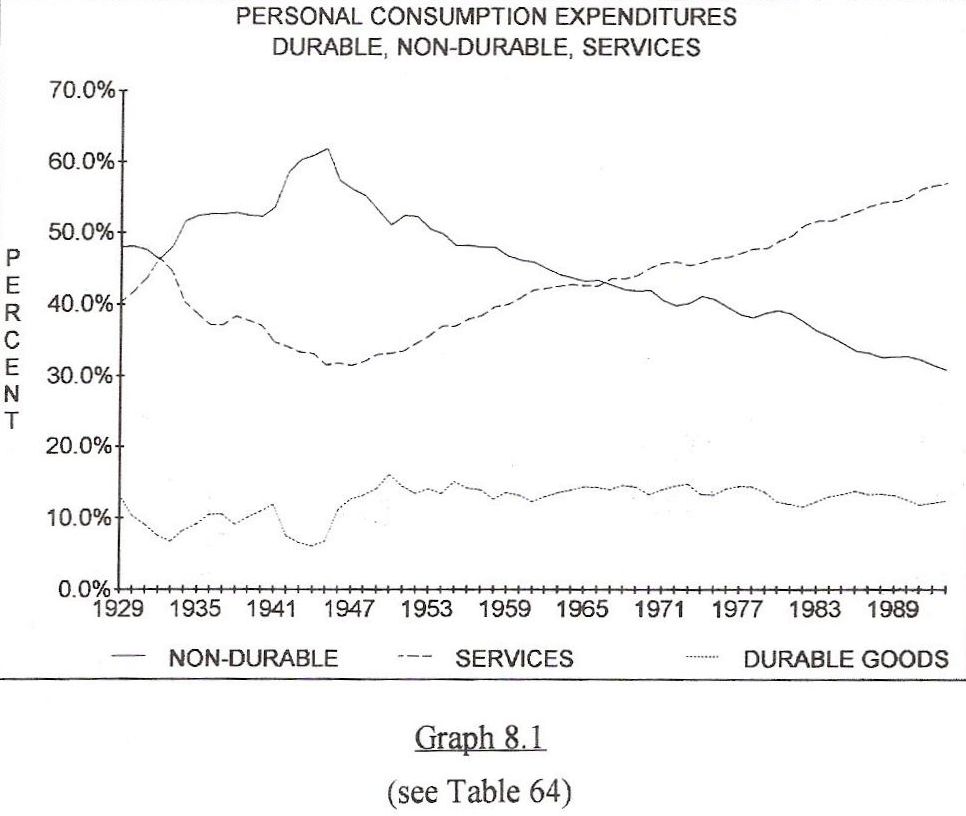
Graph 8.1
Graph 8.1 describes America's over emphasis on all types of services. The Graph separates the annual personal consumption expenditures by all Americans into three categories; non-durable goods, durable goods, and services, and compares the spending patterns of 1950 to the spending patterns of 1991.
In 1950, 2/3 of personal consumption expenditures were dedicated to non durable and durable goods, while 1/3 was spent on services.
In 1991, only 46% of all purchases were dedicated to durable and non-durable goods, while over 1/2 of all personal consumption expenditures was spent on services.
Most Americans have too little debt free money, and too much of that money is spent on services. This produces a syndrome that makes more and more services available and exacerbates the economic problems of America's production economy.
THE LOGIC OF BASIC ECONOMICS
Basic economics is logical. An organized society produces necessary consumable products from raw materials. Money must be earned at a sufficient rate by a society to generate reciprocal barter power and consume production. Over time, a society demands more services that add to the quality of life after basic needs are met.
The efficient production and consumption of essential energy in the form of food, clothing, and shelter affords societies the luxury of producing and consuming non-essential services.
A sound and profitable production system must be the cornerstone of every society. This production system supports a service economy. This production system produces the essential structure of an organized society. Therefore, production is primary, services are secondary.
The decentralized ownership of private wealth can only increase if the raw materials energy extracted from the land is valued to represent a fair return on labor energy expended. Otherwise, privately owned wealth is accumulated only by those who profit from capital debt expansion.
NATURE CREDITS EVERY SOCIETY WITH BASIC TANGIBLE VALUE
Raw materials are the primary building blocks for every production system. Their value should be tabulated annually by the Bureau of Economic Analysis (BEA). After searching U.S. government records, no complete accounting of the wealth from the earth was found. However, a 25 year old Commerce Department publication was found in the Brookings Institute library called "Raw Materials in the U.S. Economy. It was too conceptually flawed to be used as source material for this project.
With no single source for information, a record of raw materials income for the 20th century was compiled from individual sources.
Scores of government agencies and trade organizations helped gather this data. Without them, the job of creating this permanent record would have been impossible.
These agencies include the Economic Research Service (ERS) of the USDA, and the National Agriculture Statistical Service (NASS) of the USDA, The Bureau of Mines, The U.S. Department of Energy, The National Oceanic and Atmospherical Administration (NOAA), Texas A&M University at Galveston, The Presidents Council of Economic Advisors, The University of Texas at Austin, The U.S. Department of Labor, The Weights and Measures division of the Texas Department of Agriculture, The U.S. Forest Service, and The Census Bureau.
Major contributions were made by the following trade organizations: The American Petroleum Institute of Washington, DC, The American Forest and Paper Association, The American Plastics Council, The Aluminum Associates, The Glass Packaging Institute, and The Steel Recycling Institute.
Table 65 is the record of the value America has placed on the wealth extracted from the earth since 1910.
This Table is a historical record of actual raw materials value, plus it's a record of underpricing raw materials in terms of a par exchange value with finished goods.
These par exchange values are based upon the principles distilled in previous chapters. These principles establish the values of raw materials on a parity or "equity of exchange" basis with consumer goods.
The following five steps can be used to conceptualize the discipline of raw materials economics.
·1. The volume of raw materials removed from nature, becomes a society's usable metabolic or kinetic energy. Therefore, the energy within the materials determine the number and value of jobs available to produce, transport, process, manufacture, distribute and retail finished products made from these materials.
·2. The value placed on raw materials determine the amount of money that can be paid for the retail inputs used to produce raw materials for the first point of sale and therefore governs the price and volume of retail inputs purchased by raw materials producers.
·3. Retail input purchases by raw materials producers and the input purchases by other sectors of the economy at subsequent stages of the same production cycle, are a primary method of job creation and ultimately provide the consumer income necessary to purchase raw materials after they are manufactured into finished goods.
·4. Equity of exchange between raw materials and finished goods (primary reciprocal barter power) automatically creates optimum markets for domestically produced manufactured goods by creating the same earned income that will be used for personal consumption expenditures.
·5. The act of production times the optimal value of production, or the proper relationship between production and price creates the economic credits necessary for the debt free consumption of finished goods.
FIVE WAYS THAT RAW MATERIALS RELATE TO MONEY
·1. A society's annual production of raw materials must be represented in the economy by a sufficient amount of debt free currency (a price level) to optimize the reciprocal barter power between the raw materials output sectors and raw materials input sectors of the economy. This level of currency in free circulation (based on denominations) must be sufficient to optimize the reciprocal barter power of the input sectors of the economy at all subsequent stages of the production cycle.
·2. The amount of wealth in flow within the economic pipeline (at various stages of the production cycle) must be represented in the economy by a sufficient level of currency in free circulation (a price level) to foster the debt free consumption of finished goods.
·3. Finished consumable goods, once produced and warehoused, must be monetarily represented somewhere in the economy by more than their minimum domestic labor value equivalent in free currency, so consumption of finished goods can occur without supplemental debt or abstinence from consumption. (a surplus of production in the midst of poverty)
·4. The volume of debt free currency available to distribute current production and facilitate the subsequent expansion of commerce is governed by the value placed on raw materials at the first point of sale.
·5. The optimized value of raw materials finally becomes the primary source of personal savings and business investment.
The preceding conclusions relating to equity of exchange and money explain why the economy can't sell underpriced raw materials into a high priced retail market without replacing the underpayment with capital debt, interest driven inflation, abstinence from consumption and a high rate of unemployment.
DISCOVERING THE FORMULA OF RAW MATERIALS ECONOMICS
In 1935, the preceding logic was reduced to a single formula that was found to produce prosperity each time it was utilized and just as certainly produced recessions, depressions, or non-repayable debt expansion each time it was ignored. This formula was developed by Carl H. Wilken of Sioux City, Iowa.
Wilken attracted many to his cause, such as Dr. John Lee Coulter, Dean of the Agriculture at the University of North Dakota and advisory board member to the U.S. Tariff Commission. Mr. Charles B. Ray, an engineer by training who worked under contract for Sears, Roebuck & Company, and who convinced Sears to fund Wilken's research. Mr. J. Carson Adkerson, President of The American Manganese Producers Association, Mr. M.C. Smithson, President, Southern Ores Inc., Mr. O.L.Brownlee, Editor of The Sioux City Tribune, and Mr. C.H. Taylor. Associate Editor of the Country Gentleman. Together, they formed an organization called the "Raw Materials National Council" in 1937. It became the research and coordinating body that brought the 1-5 and the 1-7 formula to national prominence and eventually built a coalition that still exists today.
These men were exasperated by the study of economics because most college textbook theories had no logic base in mathematics. They wanted specific math based answers to economic questions that seemed beyond the spectrum of economic study. They wanted to understand the origin of wealth, and how wealth relates to profits and savings. They wanted to understand how a nation filled with natural resources and skilled human labor could subject itself to boom and bust cycles.
Three of these men, Wilken, Ray, and Coulter spent two full years searching for answers. They went back to the earliest records of the U.S. economy. They made a comprehensive study into how the economy functions and grows. They did not pursue theories. Instead, they audited each segment of the economy to trace the way each segment acts and reacts to other segments. To do this, they applied a system of accounting that was based upon math and physics. They applied ratios. They discovered the most consistent factor within the economy was the flow of raw materials through the economy. This led to the discovery that the ups and downs of economic activity are a direct result of what happens to raw materials prices and to annual volumes of raw materials production.
Wilken, Ray, and Coulter reasoned that raw materials income was primary income because it represented the first dollars that the nation paid itself each year for tangible value and therefore denoted the beginning of a "production cycle." They concluded that raw materials income is the value a society places on its primary energy, both metabolic and kinetic. Thus, raw materials contain the energy necessary to create National Income.
These men attempted to trace the economy to alternative origins such as wages and salaries, financial business profits, and exports. However, the only consistent causative relationship was the ratio that existed between raw materials income or its component factors to National Income. This led to their discovery that National Income rises and falls at a rate 5 times greater than raw materials income. Wilken later discovered that annual profits and savings equaled total annual raw materials income and that profits and savings followed the ups and downs of raw materials income on a 1 to 1 basis. Shortly thereafter, Ray discovered that blue collar factory payrolls also follow the ups and downs of raw materials income on a 1 to 1 basis.
These relationships or ratios were so consistent that these men were able to predict the National Income one full year in advance within less than one-half of 1% error. The formula is simple. Add up all raw materials income earned during the pervious calendar year and multiply it by five to find the earned National Income of the upcoming year. After several years of accurate predictions, they discovered a shortcut to the formula. They discovered that USDA gross farm income numbers multiplied by 7 produced a number that approximated earned National Income. This shortcut was easier because total raw materials income is not compiled by government, but farm income is continuously updated and published by USDA. This 1 to 7 formula was found to be quite accurate because gross farm income usually represents 2/3 of all raw materials income. This conferred upon agriculture (the nations source of metabolic energy) a pivotal role.
The first base period used to extract the formula from government records was 1910 through 1914, which became the original base years of 100 for indexing farm parity. During that period, gross farm income totaled 29.59 Billion Dollars and National Income totaled 154.3 Billion Dollars or a ratio of 1 to 5.21.
In 1919 farm prices began to fall and between 1920 and 1922 gross farm income dropped from 12.55 Billion Dollars to 9.90 Billion Dollars annually. This caused National Income to fall from a 1920 level of 71.7 Billion Dollars to a January 1922 level of 59.5 Billion Dollars or a drop of $4.60 of National Income for every $1.00 of lost farm income.
The second base period used was 1925 through 1929. This later became the select base period for the Office of Price Administration (OPA) during WWII. During that 5 year period, gross farm income totaled 58.7 Billion Dollars and National Income totaled 392.7 Billion Dollars, or $6.69 of National Income was created for every $1.00 of farm income created.
Wilken and his associates also calculated the ratios of the depression years. The great depression began predictably with farm income peaking in 1929 at 11.9 Billion Dollars and then falling to a 1932 level of 5.3 Billion Dollars. Likewise, National Income fell from the 1929 level of 85.3 Billion Dollars to the 1932 level of 42.8 Billion Dollars, or a loss of $6.43 of National Income for every $1.00 of lost gross farm income.
The "New Deal" did nothing to foster permanent economic recovery. Through the depression years, private debt was reduced by 31.5 Billion Dollars through lost equity and bankruptcy while public debt was expanded by 32.1 Billion Dollars. This created no net gain, and a false economy. When this situation was further analyzed, the researchers found that farm income which peaked in 1929 at 11.9 Billion Dollars did not recover until 1941 when it reached 11.1 Billion Dollars. Likewise, National Income, which peaked in 1929 at 85.3 Billion Dollars didn't recover until 1941 when it once again reached and surpassed 80 Billion Dollars.
They calculated the ratio of farm income to National Income at 1 to 7.16 just before the depression, and 1 to 7.20 at the end of the depression.
In later years, a third base period was used to cement the ratios into place. This third base period was 1946 through 1950, a post war era during which price stabilization for farm raw materials was operative as a consequence of federal farm parity laws and other WWII stabilization measures. During that period, gross farm income totaled 141 Billion Dollars and National Income totaled 1055.5 Billion Dollars or a ratio of $1 of gross farm income to $7.49 of National Income. So, decade by decade, the ratios developed as follows:
1910-14, a ratio of.................................1 to 5.21
1920-22 a depression drop of..................1 to 4.60
1925-29, a ratio of..................................1 to 6.68
1929-32 a depression drop of...................1 to 6.43
1940 end of depression ratio of.................1 to 7.16
1946-50 post WWII base period ratio of....1 to 7.49
Thus a pattern was established that demonstrated future predictability. Wilken, Ray, and Coulter used these ratios to analyze and forecast the economy. They discovered other ratios that expanded in response to improved technology and efficiency. They concluded these ratios actually represented linear multipliers that were governed by the flow of raw material energy and these ratios slowly expanded as the annual flow of energy was made more efficient by new technology.
These same multipliers can be identified today by making adjustments that acknowledge America's move to a debt driven private enterprise system.
To perfect this update, it was necessary to acknowledge the effect of annual public and private debt expansion on National Income. After annual debt expansion was calculated, it was added to actual raw materials income to establish the combined raw materials and debt expansion generator. When these combined annual totals were examined against National Income in 1987 constant dollars, causation re-appeared in numerous ups and downs from 1952 through 1992. This experiment failed if either annual debt expansion or raw materials income was used alone because, due to low raw material prices, both inputs must be applied to regenerate the economy.
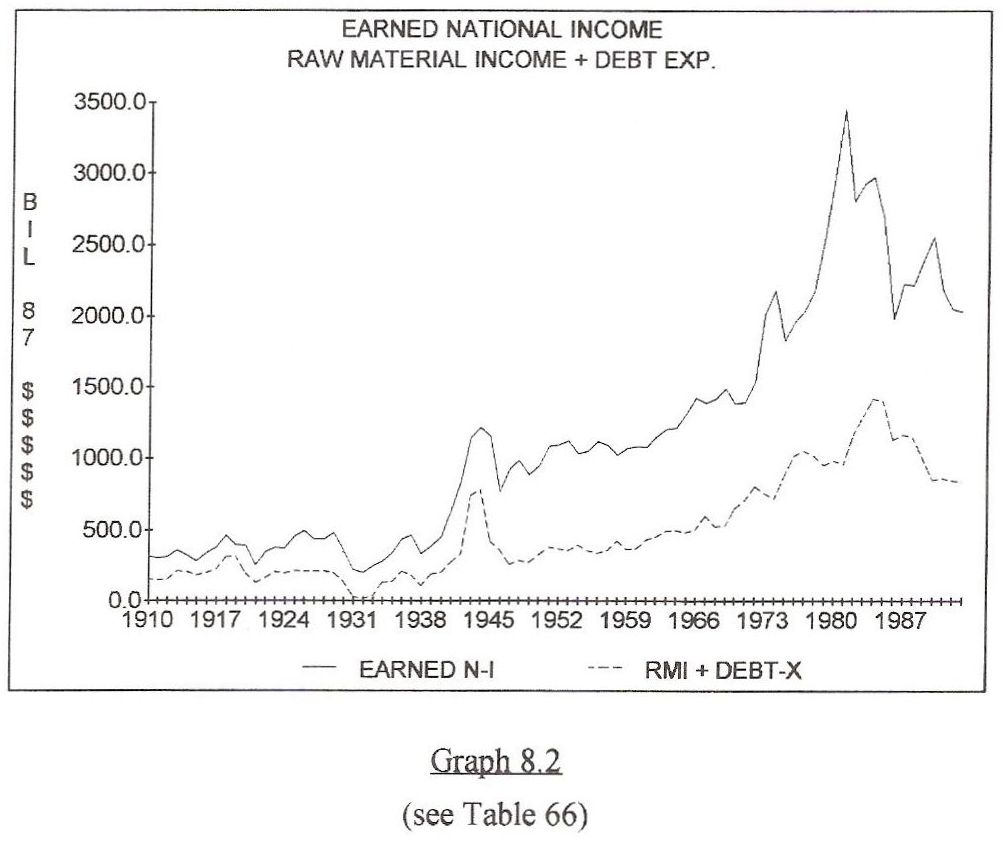
Graph 8.2
Graph 8.2 is the result of combining raw materials income with debt injection. On this graph, the driver effect of raw materials income plus debt expansion is apparent as the peaks and dips of the bottom line on the graph which represents raw materials income plus debt expansion correlate to the dips and peaks of Earned National Income on the top line of the Graph.
The concept of Earned National Income is important. It was developed by using a formula which will be examined in detail in future chapters. In essence, Earned National Income is determined by multiplying raw materials income times the Raw Materials Multiplier for the year. In other words, if the multiplier was 7.28, Earned National Income would total the value of gross raw materials income at the first point of sale times 7.28. Since this Graph is drawn from constant dollars, it's easy to see the growth of the multiplier as the state of the arts and debt expansion combine to expand the ratio.
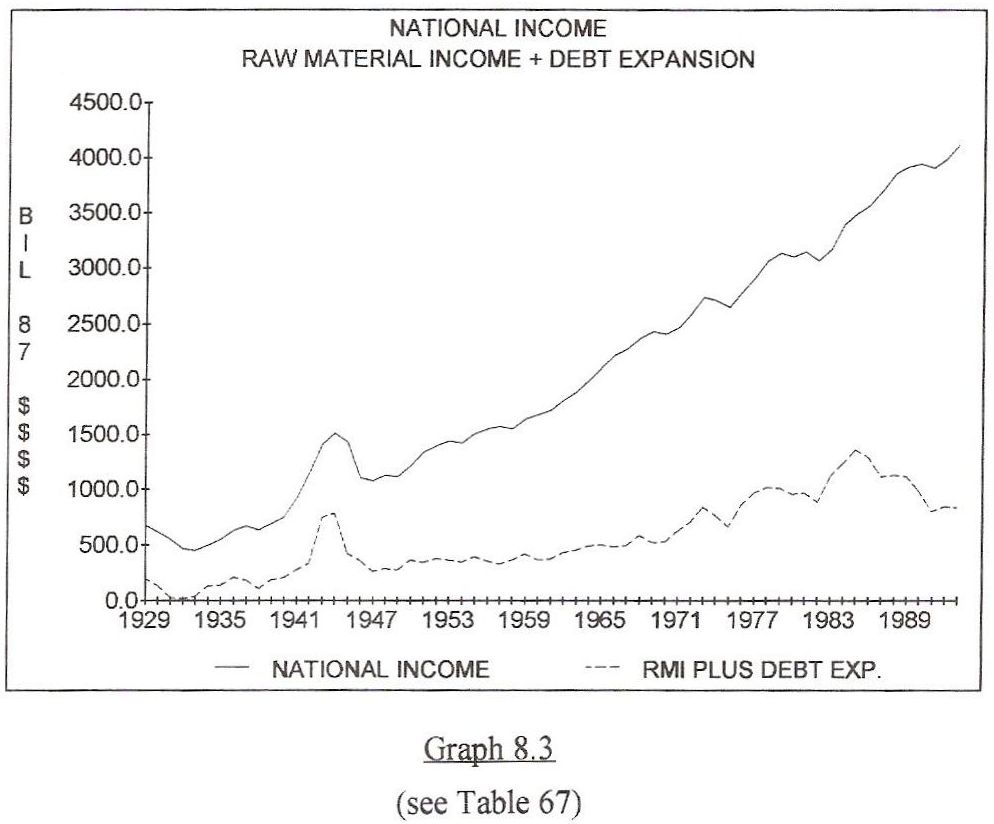
Graph 8.3
In recent decades, debt has "filled in" around raw materials income as the un-repayable substitute for the earned income system quantified by Wilken and his associates. Graph 8.3 shows that raw materials income when combined with debt expansion has become the synthesizer of National Income. This was discovered by reviewing the combined multiple of raw materials income and debt to National Income from 1910 through 1993. The combined National Income generator of raw materials income and debt now functions at an average ratio of $5.38 of National Income for every $1 of raw materials income plus debt, which is the raw materials income plus the additional debt that's injected into the production cycle each year.
The same 1 to 5 ratio existed during the 1946-50 base period, but during that time, the economy periodically functioned without excessive debt expansion because raw materials were monetized. During those years, the ratio of approximately 1 to 5 existed between raw materials income and National Income without debt expansion.
The disturbing aspect of this graph is that today's roll over of dollars occur at 5.38 to 1. This is too low. Current state of the art technology demands a much more efficient roll over of money through the economy from the beginning to the end of the production cycle.
Upcoming chapters will demonstrate that the proper rate of turn should be 1 to 7.28 in 1994 instead of 1 to 5.38. This increased efficiency can only occur if debt is not substituted for raw materials income.
THE ROLE OF FARM INCOME IN THE ECONOMY
The farm income component of raw materials income is prominent. Therefore, Wilken and his associates used farm income as a short cut to predict National Income. They found that gross farm income is an excellent measuring devise for several reasons.
·1. Farm products represent the largest and most consistent raw materials component within the production cycle and thus carries a predictable causation to National Income.
·2. The production, processing and distribution of farm based products employs over 20 million Americans.
·3. Farm production is a necessity for any society, so the value and output over the long run is predictable.
·4. The federal government recognizes the importance of food production, processing and distribution, and spares no expense in calculating gross and net farm income as well as farm production output on a monthly basis. This is not true with other raw materials that flow through the economy at lesser volumes.
Wilken and his associates analyzed farm income from two perspectives. First, gross farm income was quantified as a National Income generator for urban America, because it produces primary income for many sectors of the economy. Second, it was quantified as income for rural America because it produces a substantial net component of the profits of private enterprise (net farm income).
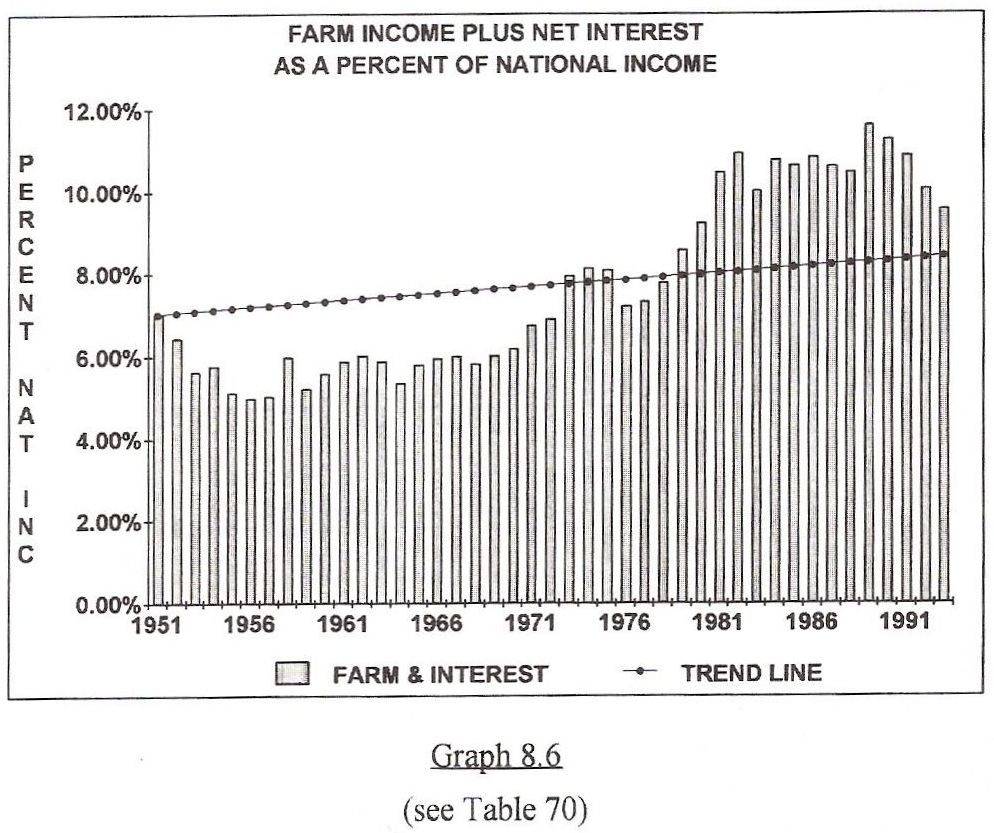
Wilken and his associates found that during the 1946-50 base period, net farm income comprised about 7% of National Income which allowed gross farm income to roll through the urban economy at a multiple of 1 to 7.
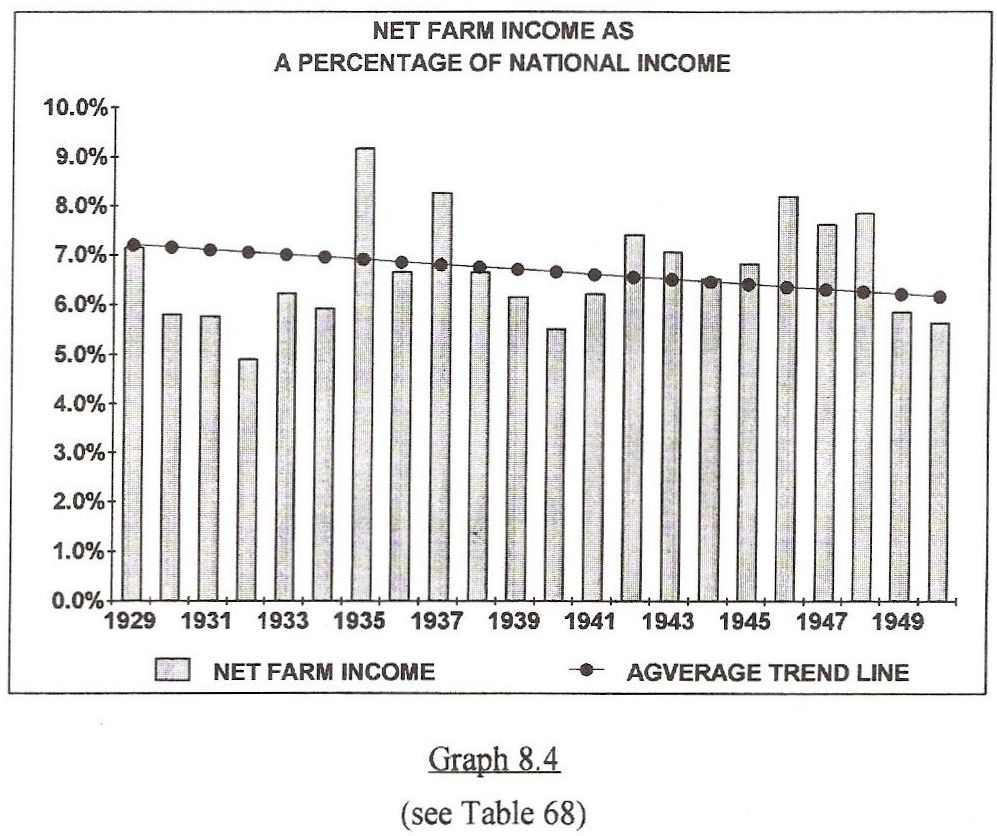
THE ORIGINAL 1 TO 7 RATIO
Graph 8.4
Graph 8.4 shows this effect. From 1929 through 1950 net farm income averaged about 6.5% of National Income. The Graph reflects a gradual reduction in the farm income component of National Income. This reduction is a reflection of improvements to technology that allow more workers to be employed outside agriculture and other new wealth industries. It's a reflection of gradual improving efficiency.
RAW MATERIAL INCOME PLUS DEBT GENERATE NATIONAL INCOME
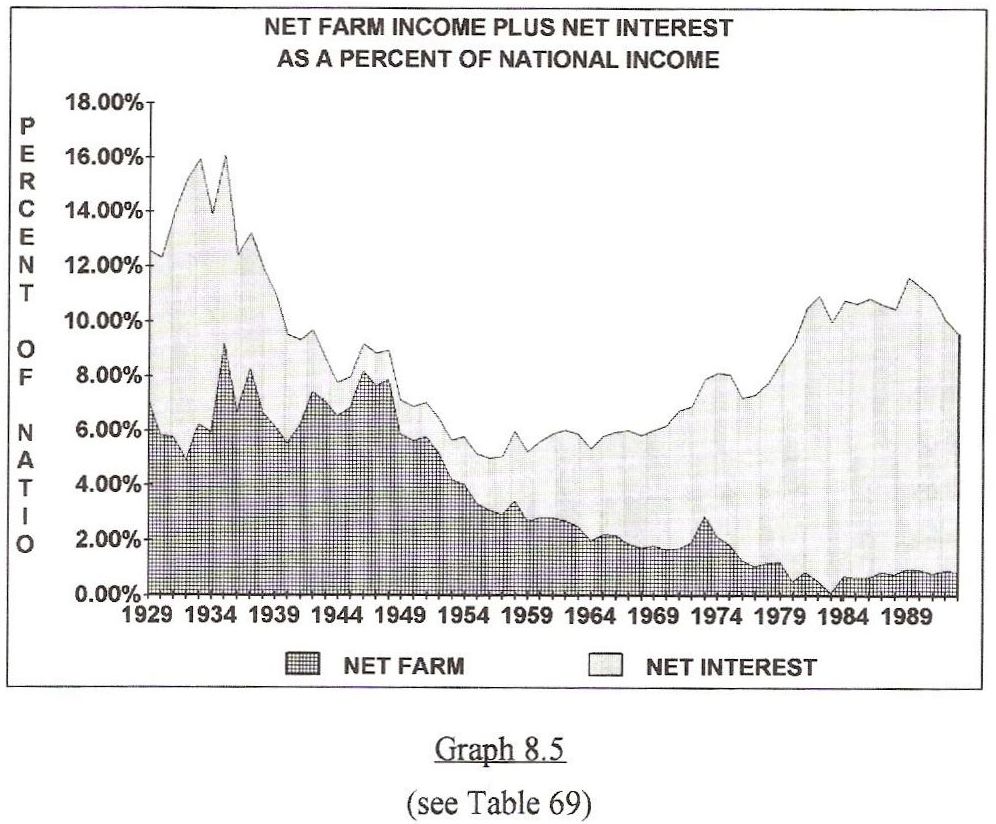
Graph 8.5
Graph 8.5 shows how new wealth and new debt combine to manufacture National Income. It describes this concept in terms of the percentage of National Income allocated to net farm income and net interest over the years.
Raw materials income generates National Income as it enters the economy at the foundation level. However, when this income is inadequate, a specific amount of debt must be added for commerce to function.
This added debt contains a net cost which the U.S. Department of Commerce defines as Net Interest. This interest compounds to produce a negative form of wealth proportional to the loss of raw materials income.
Graph 8.5 reflects the actual value removed from the net farm income portion of raw materials income, and thus the amount of value removed from the profits of private enterprise. Likewise, it reflects a permanent addition to the cost that must be paid by non-financial private enterprise.
The combined total of net farm income and net interest have averaged 7.6% of National Income since 1951. The American society has replaced primary income with primary debt.
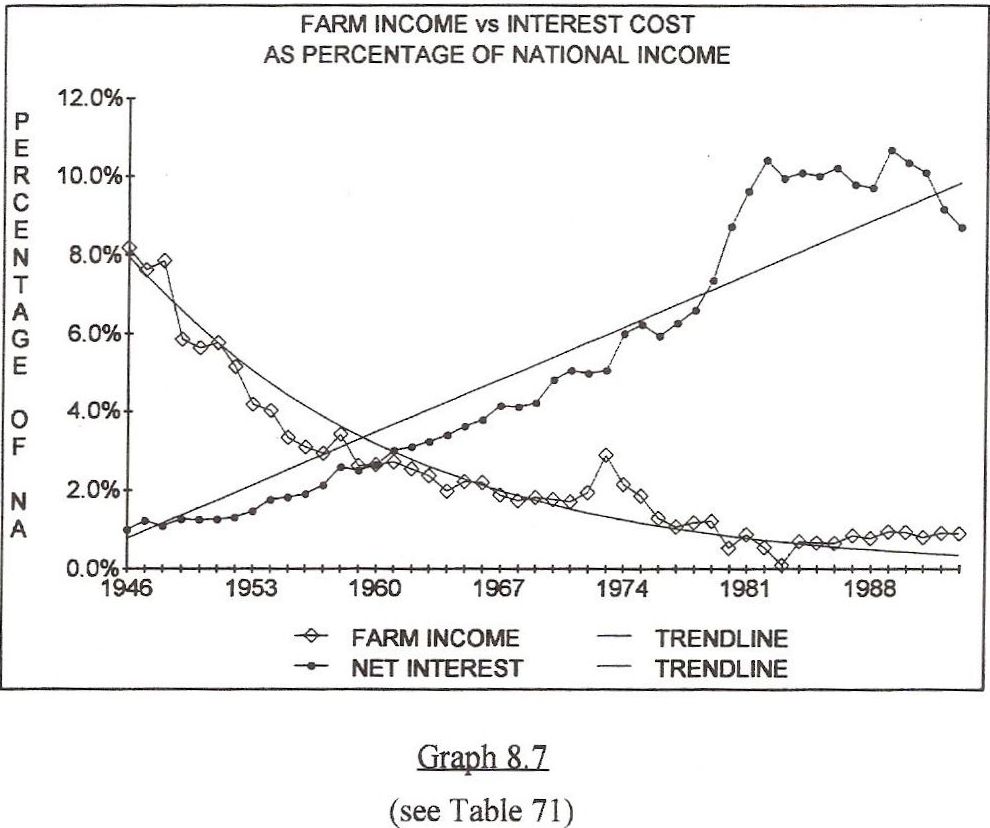
Graph 8.7
Graph 8.7 illustrates this effect on an annual basis. The interest cost line reflects the increasing cost of debt expansion. The farm income line reflects the deterioration of profits that were replaced by interest cost.
Since WWII, interest has increased from less than 2% of National Income to over 8% of National Income. Conversely, the value of farm raw materials dropped during the same period from over 7% of National Income to less than 1%, and net interest filled in the gap.
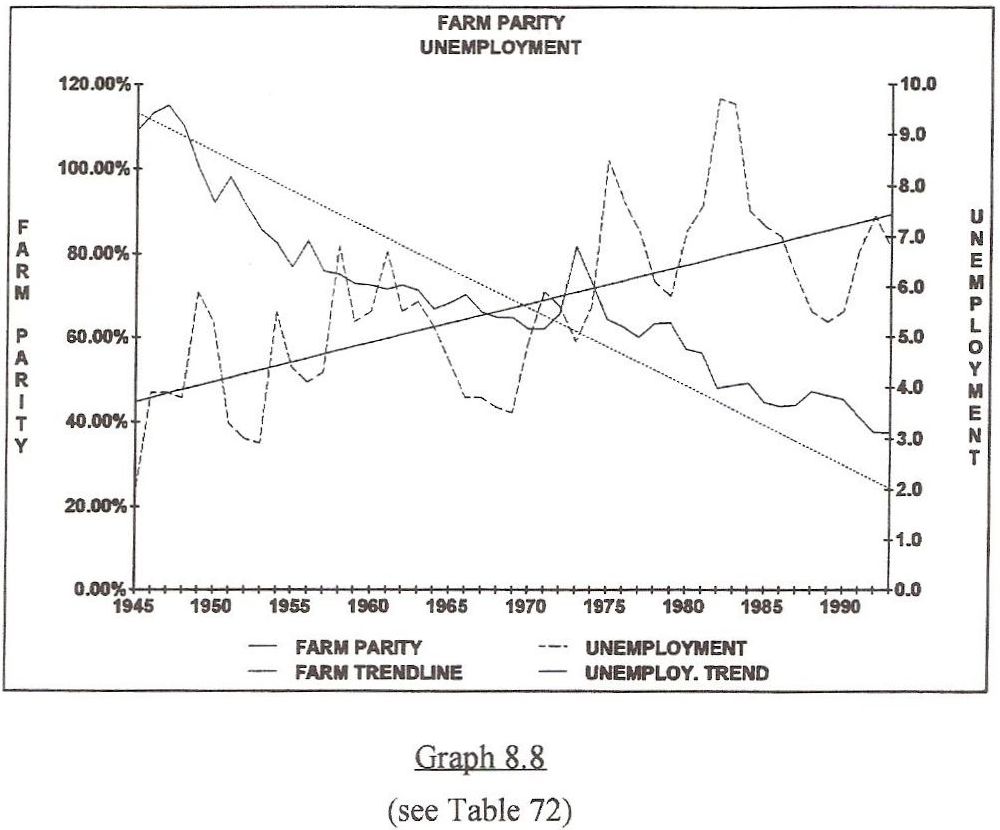
The ability of raw materials to generate National Income has been substantially curtailed in recent years. This increases unemployment.
Graph 8.8 relates farm raw materials income to unemployment. Over the long term, total unemployment gradually increases as farm income falls.
FARM INCOME AND UNEMPLOYMENT
Graph 8.8
The graph shows that when farm workers were forced into cities, they immediately competed with and displaced a portion of the annual supply of new urban workers. This surplus of labor increased overall unemployment.
The Two Economic Generators:
100% PARITY RAW MATERIALS INCOME OR DEBT EXPANSION
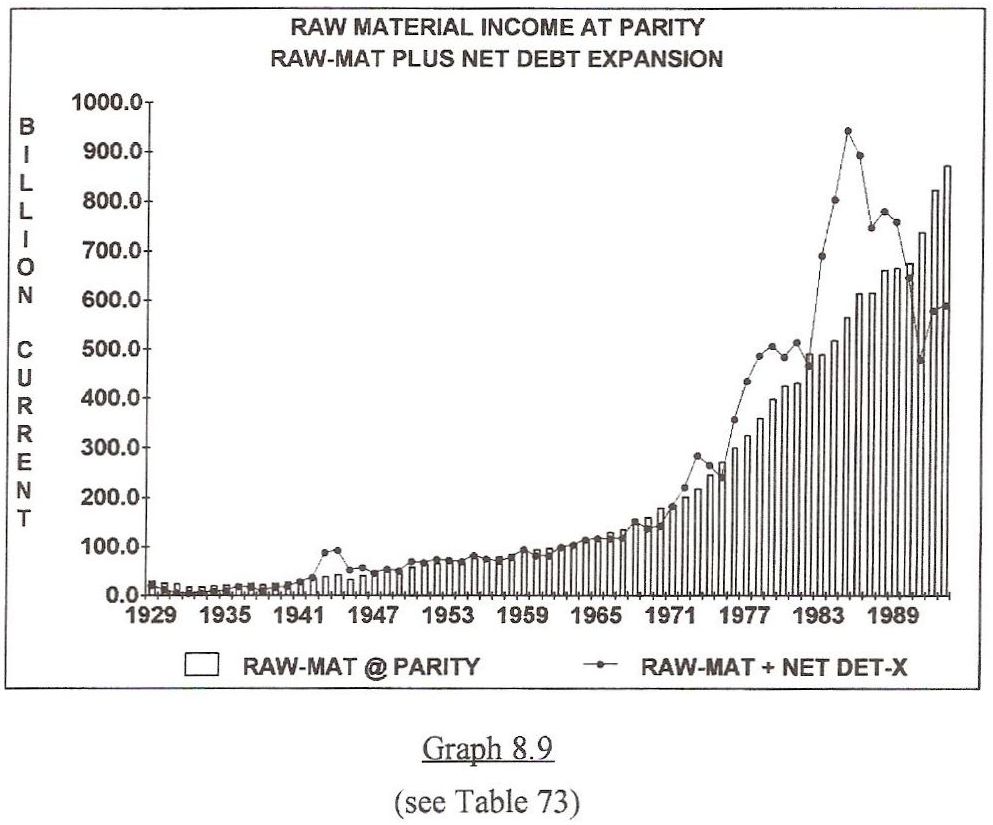
Graph 8.9
Graph 8.9 plots the par value of raw materials on one line and the actual value of raw materials plus debt expansion on the other line. This compares a "parity" exchange value for raw materials to actual raw materials income plus the debt expansion used to maintain the flow of goods and services from 1946 through 1993.
In recent decades more debt expansion has been used to assist the flow of underpriced raw materials through the production cycle.
The top line of the Graph displays wild upward spikes in the cost of actual raw materials and the debt that was used to cause raw materials to flow through the economy. The lower line reflects parity raw materials values but excludes debt expansion.
The Graph illustrates that the American economy functions more efficiently with less debt and more earned income. This increased level of efficiency can only be achieved when raw materials are priced at parity. This graph is plotted in current dollars. It's easy to see (especially in the recent years) several occasions when over-borrowing expanded the economy in excess of the dollar equivalent necessary to facilitate consumption. Here is a more detailed explanation.
In 1970, raw materials prices dropped to a 20th century low of about 50% of the value necessary to cause production to flow through the normal system of processing, manufacturing, distribution and consumption without debt. During the early 1970's, the economy attempted to self correct, and raw materials prices (the new income that entered the production cycle from agriculture, forestry, fishing, mining, and recycling) almost doubled.
The central bank failed to recognize the impact of this change on the economy. Instead of raising the reserve requirements of banks to capture this new money as profit and savings, the Federal Reserve doubled the fed funds rate. Meanwhile the local banks, the Production Credit Associations and Land Banks re-loaned this new wealth back into the economy so it was converted to debt and inflation through fractional lending.
The first of these inflationary events is displayed on Graph 8.9 as the "inverted V" which began in 1971 and lasted through 1975. Due to "corrective" measures instigated by the Federal Reserve, by 1976 raw materials prices had dropped from a high of about 72% of par value to about 62%, and the economy (for a brief period) replaced raw materials income by adding debt.
The Federal Reserve did not recognize that the economy had attempted to earn its way out of debt, so it instituted a policy of "killer" interest rates which prevented borrowers from repaying their loans with cheaper dollars. Consequently, the Fed Funds rate, which is the interest rate that banks pay each other for loans, climbed to 11.19% in 1979, to 13.36% in 1980 and an unbelievable 16.38% in 1981. During this period, many borrowers paid as much as 20% interest on production loans, a rate that sent all profits into the hands of lenders.
Coincidentally, the economy tried to self-correct during this period as increased oil prices pushed raw materials income up for a second time. Consequently, from 1977 to 1981, overall raw materials prices rose from 62% of their par value to 89% of their par value. This generated an explosion of new earnings that almost doubled raw materials income again, but it was converted into debt expansion because the central bank failed to raise reserve requirements which would have forced these earnings into savings. Instead, new deposits of earned income were loaned again and again as the fractional reserve lending treadmill accelerated the economy. Eventually, the resulting inflation forced the Central Bank to strangle the economy into submission with high interest rates. Then, the economy had to be revived with unprecedented levels of debt expansion during the 1980's.
Government records prove that the recession in 1982 was inevitable. In the year prior to the recession, raw materials prices dropped from 89% of their par value to 77% of par value. As these billions of new dollars disappeared, the earned income to purchase essential production also disappeared.
Two other periods during the 20th century saw raw materials prices drop dramatically. The first time was in 1919 when prices dropped from about 92% of par value to 66% of par exchange in less than two years. This destroyed 1/3 of all new earned income. This income was needed to facilitate the consumption of finished goods. This loss precipitated the depression of 1920 and 1921.
Between 1926 and 1931, raw materials prices fell from 79% of par value to 44% of par value. At the same time, monetary policy was expanding debt at an alarming rate so most Americans ignored the time bomb of the "roaring 20's." When that bubble burst, almost 2/3 of raw materials income was missing, so the flow of goods and services was stalled. This drop of National Income produced widespread poverty because the money to buy back raw materials as finished goods no longer existed.
During the early 1980's another debt bubble was created for the purpose of covering a depression that should have occurred when raw materials prices dropped from 89% of par value in 1981 to an all time low of 47% of par value by 1986.
This giant bubble of debt remains outstanding today. It's represented by the largest "inverted V" on Graph 8.9. It gives full context to the economy of the 1980's.
Twice during a 10 year period, in 1973 and in 1981 the natural laws of exchange that govern economic growth and international trade attempted to re-balance the American economy but on both occasions, the central bank acted to depress real values.
Graph 8.9 demonstrates that parity raw materials income flows through the economy at the approximate ratio of actual raw materials income plus debt. So, the 1 in the 1 to 5 ratio can exist as either earned income or debt or any combination of the two. A proper level of income from raw materials or a low level of raw materials income plus debt is always necessary to mobilize labor.
Either paper wealth or paper debt must represent the energy from the earth that gets exchanged and consumed across the production cycle. Paying too little for the energy in raw materials, causes debt to be produced so that society can maintain previous consumption patterns.